
Figure 1.
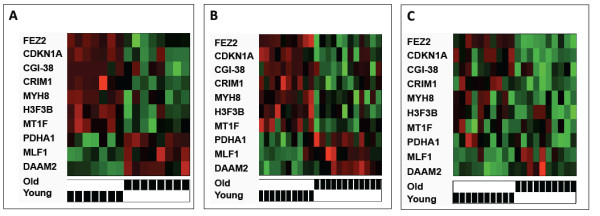
Muscle age profiling. Heatmaps displaying the relative expression of the ten gene muscle aging profile are shown comparing young males to older males in a supervised manner using Affymetrix U133A microarray gene set data for GSE362 (A) and GSE1428 (B) and in a healthy aging dataset using a NimbleGen microarray data (C). The gene expression of the profile is displayed in a supervised manner where intensity reflects relative expression (green = higher, red = lower). Heatmaps were generated using the Heatplus package in the statistical software R 2.14.0