Figure 2.
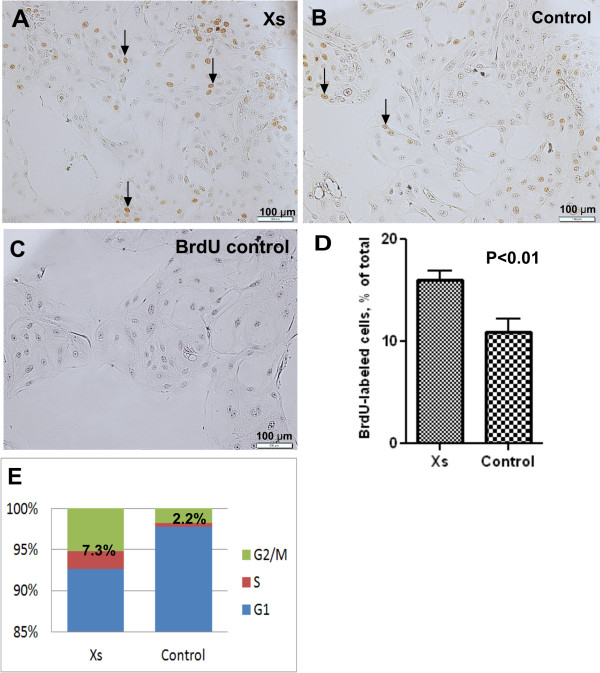
Effect of xanthosine on cell cycle progression. A-D- BrdU labeling of proliferating cultures. Photomicrograph depicting BrdU-labeled cells (brown nuclei, arrows) in xanthosine-treated (A) and control (B) cultures. Negative control for BrdU immunostaining (C). Quantification of the BrdU labeling index in xanthosine-treated and control cultures (D), expressed as a percentage of total cells. Treatment with xanthosine led to an increase in the percentage (mean + SE, n = 6) of BrdU-positive cells. Scale bar = 100 μm (photographed at 200X). E - Flow cytometry analysis of cell cycle distribution for MEC in xanthosine-treated and control cultures. Xanthosine treatment led to an increase in the number of cells in S + G2/M phases of the cell cycle.

