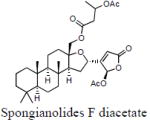
Table 3.
Log Poct values determined from gradient retention times (tR), CHI values and hydrogen bond count (HBC) using gradient elution on a PRP-1 column and software calculated log Poct for a series of marine natural products.
| Compound | tR (min) | CHI | HBC | Log Poct | Log Poct (Calc.) |
|---|---|---|---|---|---|

|
15.89 | 99.80 | 1 | 3.95 | 4.36 |

|
13.3 | 76.84 | 2 | 3.23 | 4.5 |

|
14.74 | 89.61 | 2 | 3.78 | 3.52 |

|
16.33 | 103.70 | 0 | 3.77 | 3.98 |

|
17.94 | 117.98 | 0 | 4.44 | 3.98 |

|
16 | 100.78 | 0 | 3.64 | 4.59 |

|
15.85 | 99.45 | 0 | 3.57 | 4.59 |

|
13.91 | 81.91 | 0 | 2.75 | 5 |

|
7.44 | 24.89 | 2 | 0.77 | 0.5 |

|
9.16 | 40.12 | 2 | 1.51 | 3.52 |

|
13.9 | 82.16 | 0 | 2.76 | 1.51 |

|
18.19 | 120.19 | 2 | 5.27 | 5.47 |

|
14.22 | 84.00 | 3 | 3.97 | 4.17 |

|
15.83 | 99.27 | 3 | 4.59 | 4.4 |

|
16.05 | 101.22 | 3 | 4.68 | 4.4 |

|
13.63 | 79.77 | 1 | 3.01 | 2.65 |

|
14.48 | 87.30 | 3 | 4.08 | 2.65 |

|
17.7 | 115.85 | 1 | 4.70 | 5.52 |

|
10.73 | 54.06 | 4 | 3.08 | 2.11 |

|
10.48 | 51.84 | 2 | 2.16 | 1.52 |

|
12.31 | 68.06 | 2 | 2.06 | 1.75 |

|
9.75 | 45.37 | 3 | 2.11 | 0.32 |

|
10.32 | 50.42 | 2 | 1.74 | 0.74 |
|
|
9.85 | 46.26 | 2 | 3.90 | 1.02 |
