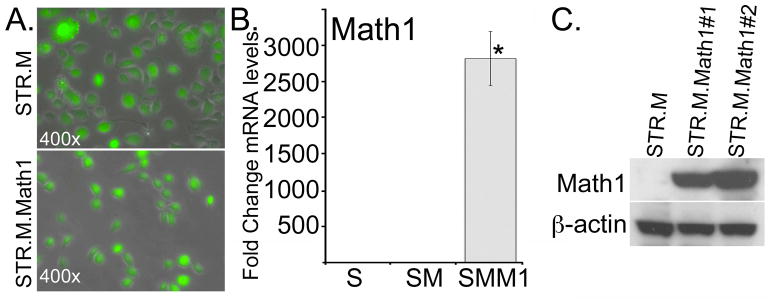
Figure 2. Establishing active Math1 expression in human esophageal keratinocytes.
Human STR keratinocytes were infected with a retroviral vector to induce Math1 expression (MIGR-Math1) or the control empty viral vector MIGR-GFP. GFP expression serves as a marker for viral infection and gene expression A. GFP fluorescence in post flow cytometry sorted STR.M control and STR.M.Math1 cells. B. Fold change in Math1 mRNA levels by QPCR after MIGR-GFP infection and selection. STR.M.Math1 cells (SMM1), compared to uninfected control STR cells (S) and MIGR1 virus infected controls (SM). ΔCt values were calculated after duplicate PCRs for each sample, then statistical analysis performed (ANOVA and Tukey Rank Mean). ΔΔCt values were then calculated and used to determine fold-change in expression. n=4. * significantly differs from STR and STR.M control cells, p<0.05. C. Western blot analysis for Math1 protein levels in control (STR.M) and Math1 expressing cell lines (STR.M.Math1#1 and STR.M.Math1#2).

