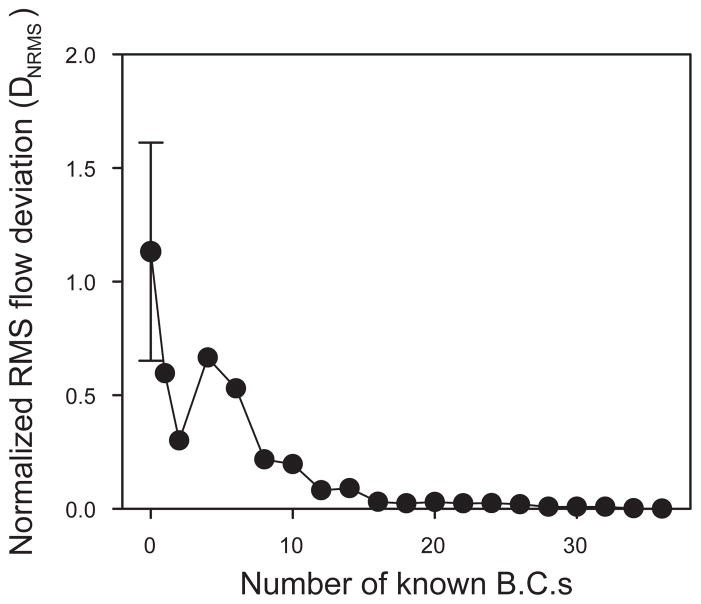
Figure 6.
Normalized root mean squared deviation in segment flows (DNRMS), plotted as a function of the number of known boundary conditions for network I. In the case of one known boundary condition, the pressure at the main venular outflow is imposed. Flow boundary conditions are then successively added in order of decreasing flow magnitude. The error bars show the standard deviation of 6 results with different randomized starting conditions. The starting conditions had negligible effects if one or more boundary conditions were specified.

