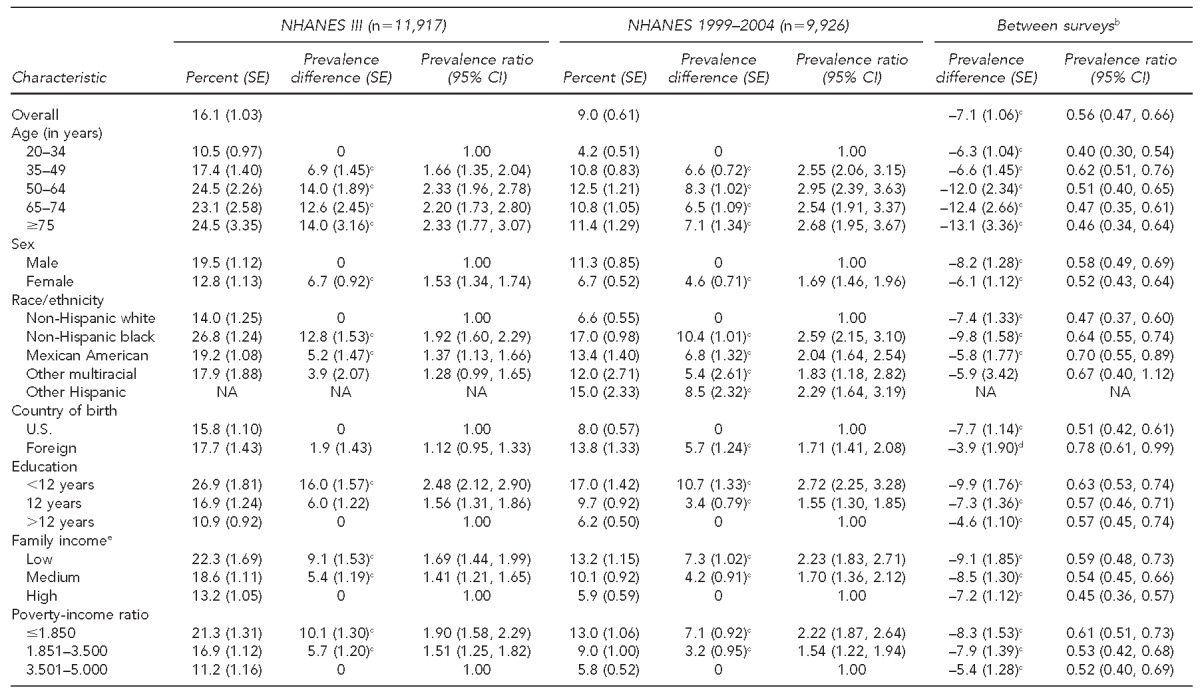
Table 1.
Prevalence of periodontal disease,a prevalence difference, and prevalence ratio estimates for selected sociodemographic characteristics in U.S. adults 20 years of age and older within and between surveys: NHANES III (1988–1994) and NHANES 1999–2004

aPrevalence (SEs) of periodontal disease (defined as at least one site with pocket depth ≥4 millimeters [mm] and at least one site with clinical attachment loss ≥3 mm) for adults 20 years of age and older. All p-values for Chi-square tests within and between surveys were <0.01 except for nativity status in NHANES III.
bPrevalence difference and ratio compare NHANES 1999–2004 with NHANES III (1988–1994).
cp<0.01 for t-test assessing the difference between the prevalence of each level of the characteristic and the level assigned as the reference
dp<0.05 for t-test assessing the difference between the prevalence of each level of the characteristic and the level assigned as the reference
eLow, medium, and high categories for income were <$14,999, $15,000–$24,999, and ≥$25,000 in NHANES III and <$19,999, $20,000–$44,999, and ≥$45,000 in NHANES 1999–2004, respectively.
NHANES = National Health and Nutrition Examination Survey
SE = standard error
CI = confidence interval
NA = not applicable
