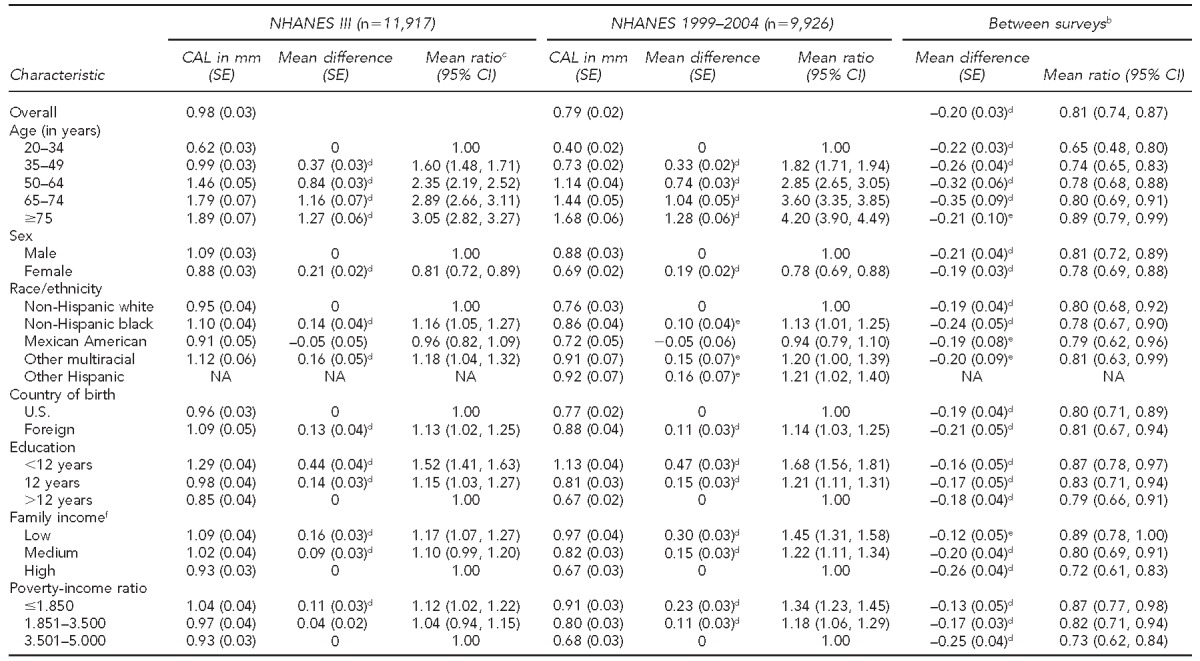
Table 3.
Mean clinical attachment loss, mean difference, and mean ratioa estimates for selected sociodemographic characteristics in U.S. adults 20 years of age and older: NHANES III (1988–1994) and NHANES 1999–2004

aMeans (SEs) for CAL for adults 20 years of age and older
bMean difference and ratio compare NHANES 1999–2004 with NHANES III (1988–1994).
cSEs for ratios calculated using the delta method from estimates obtained from SUDAAN
dp<0.01 for t-test assessing the difference between the prevalence of each level of the characteristic and the level assigned as the reference
ep<0.05 for t-test assessing the difference between the prevalence of each level of the characteristic and the level assigned as the reference
fLow, medium, and high categories for income were <$14,999, $15,000–$24,999, and ≥$25,000 in NHANES III and <$19,999, $20,000–$44,999, and ≥$45,000 in NHANES 1999–2004, respectively.
NHANES = National Health and Nutrition Examination Survey
CAL = clinical attachment loss
mm = millimeters
SE = standard error
CI = confidence interval
NA = not applicable
