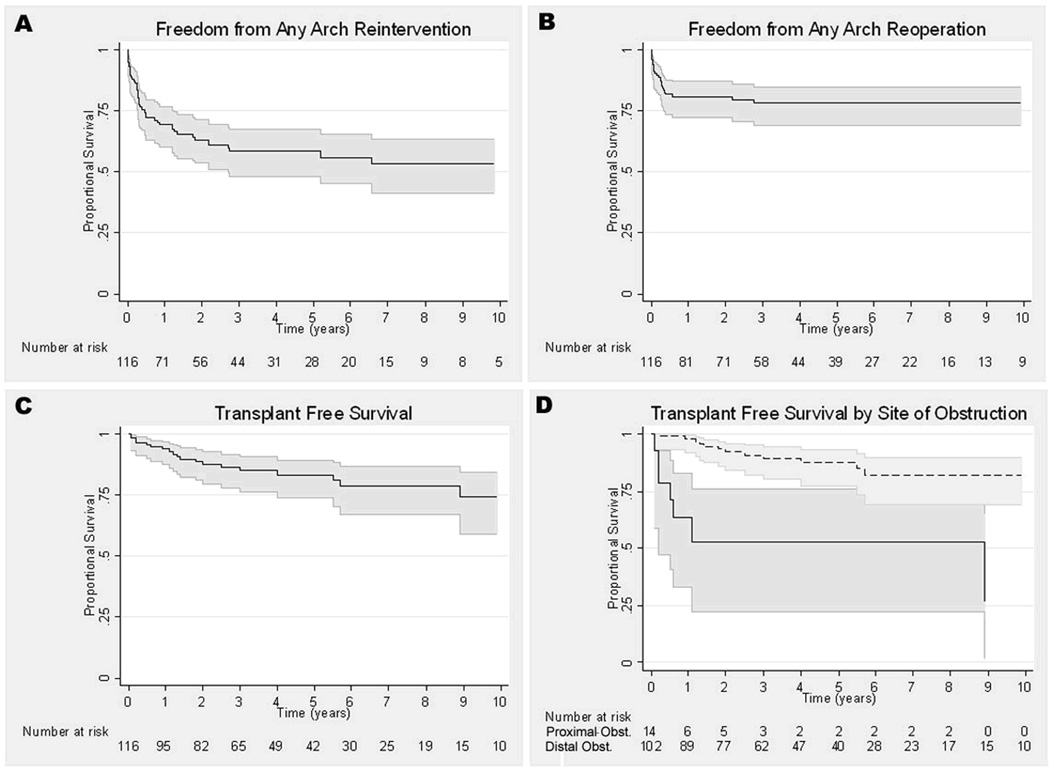
Figure 4.
Kaplan-Meier curves representing survival analysis for entire cohort. A. Freedom from any arch reintervention. B. Freedom from any arch reoperation. C. Transplant free survival. D. Transplant free survival by site of obstruction (obst.), proximal (solid line) or distal (dotted line). 95% confidence intervals are represented by the gray lines around the survival function (dark line).

