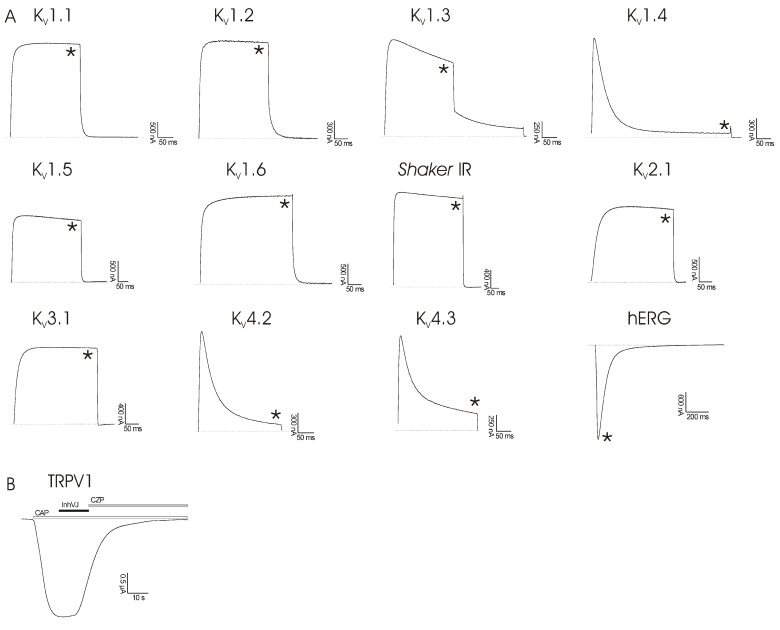
Figure 5.
(a) Activity profile of InhVJ on several KV channel isoforms and the cardiac hERG channel. The figure shows the results of one representative experiment. Whole-cell current traces in control and inhibitor conditions are shown. The dotted line indicates the zero-current level. The asterisk (*) marks steady-state current traces after application of 50 µM inhibitor. No differences in currents were observed between control and toxin situation. (b) Activity profile of InhVJ on TRPV1-receptor. No activity after application of 10 µM InhVJ was observed. CAP = capsaicine (2 μM); CZP = capsazepine (10 μM). All data represent the average of at least three independent experiments (n ≥ 3) and are presented as mean ± standard error.

