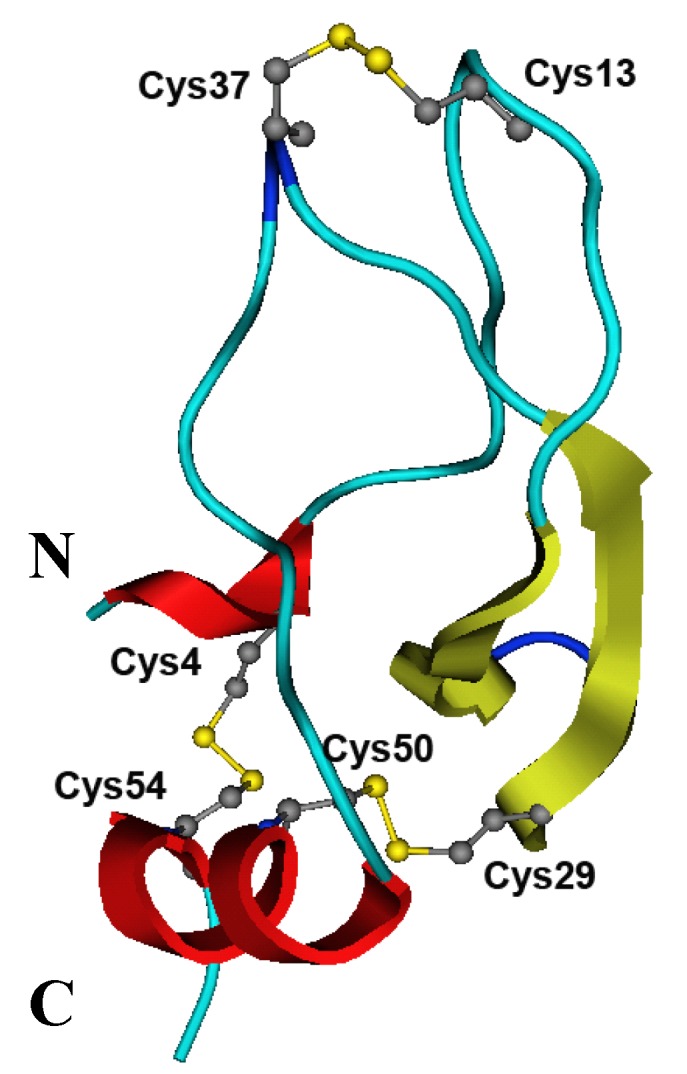
Figure 6.

The structural model of InhVJ. The structure is shown as a ribbon diagram, where α-helixes are indicated by red color, β-strands by yellow, β-bends by dark blue, and disordered structure by blue colors. The positions of disulfide bonds in the structure of the inhibitor are indicated as dots of grey and yellow colors.
