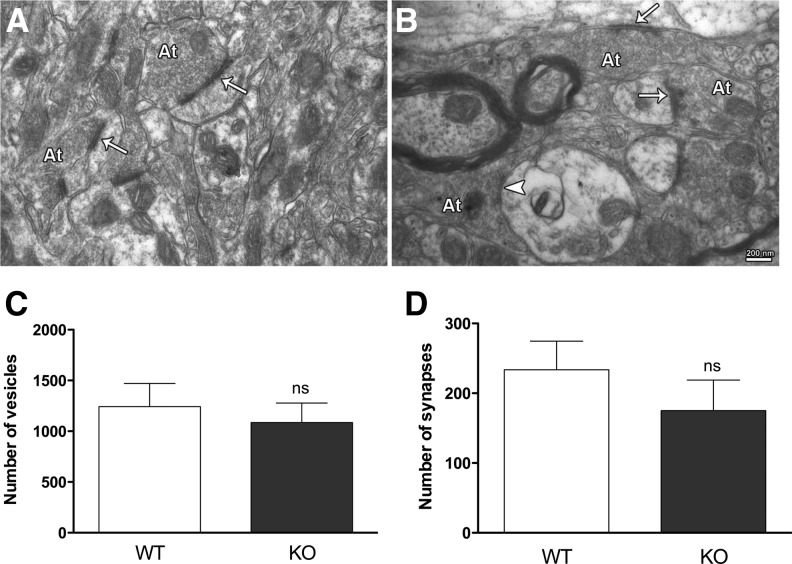
Figure 7.
Electron microscopy images of synapses in the dorsal striatum of WT (A) and DA-βcat KO (B) mice. Axon terminals (At) were characterized by the presence of synaptic vesicles and mitochondria. Both asymmetric synapses identified by the presence of thick post-synaptic densities (arrows) and symmetric synapses characterized by thin post-synaptic densities (arrowhead) were included in the analyses. Synapses were counted and photographed at a magnification of 12,000×, and synaptic vesicles were counted and photographed at a magnification of 50,000×. (C) The number of synaptic vesicles was counted in at least 100 synapses per group. Student's t-test; P > 0.05. (D) An area representing 1200 µm2 of dorsal striatum per animal was used for quantification of synapse density. Asymmetric and symmetric synapses with well-defined post-synaptic density areas were quantified. Although the KO animals exhibit a smaller number of synapses as well as a decrease in the number of synaptic vesicles, the differences between the means were not significant. Student's t-test; P > 0.05.

