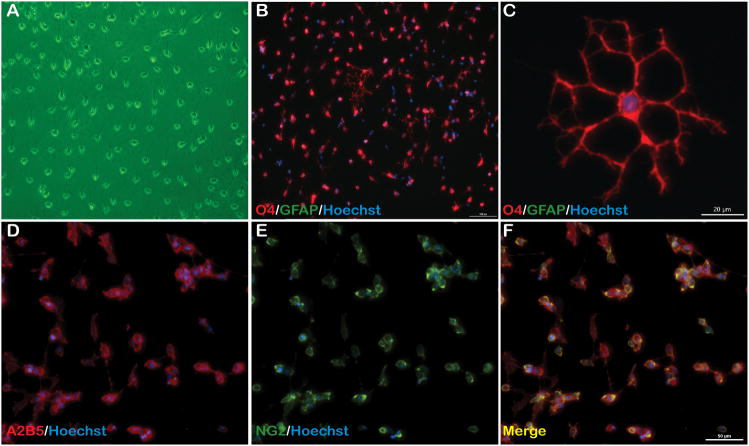
Figure 1. Isolated cells express multiple OPC specific surface markers.
(A) Phase contrast image of OPCs 3 days following isolation showing typical OPC morphology and (B) isolated cells are O4+ and GFAP−, 10X. (C) O4+ OPCs form multiple processes following plating; scale bar = 20 μm. (D–F) Following initial passage, OPCs are A2B5+/NG2+, indicative of early OPC surface markers; scale bar = 50 μm, 20X.

