
Figure 3. Expression of the GSH-Linked Pathway Exhibits an Intermediate Fitness Optimum.
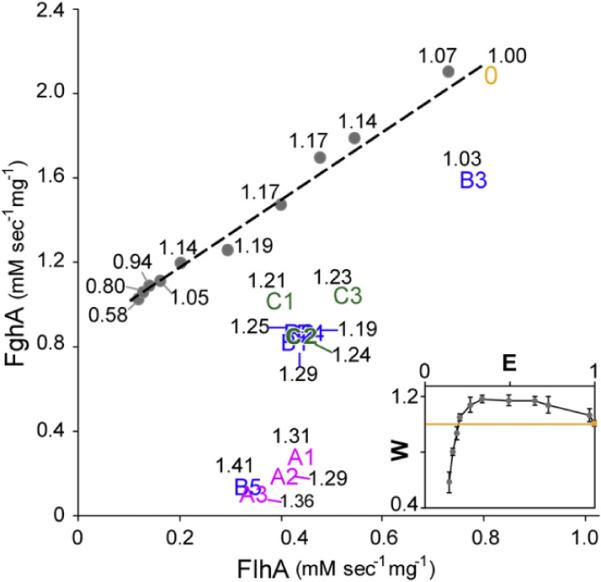
Enzymatic activities of plasmid haplotypes are indicated by their index numbers (0, ancestral pCM410; A1–A3, Class A haplotypes; B1–B5, Class B haplotypes; C1–C3, Class C haplotypes). Grey dots denote expression levels explored by the inducible expression plasmid pHC112. The corresponding fitness value of each data point is shown in black text. The inset shows the correspondence between enzyme activity (E) and fitness (W). pCM410° (yellow dot) and pHC112 (gray dots) are perpendicularly projected onto the orthogonal regression line (dashed line) of their FlhA and FghA enzyme activities. The yellow line in the inset denotes the fitness value of 1.0. Enzyme activity shown in the inset is expressed in terms of the relative distance between each projected point and the y axis intercept of the regression line. Error bars are 95% confidence intervals.