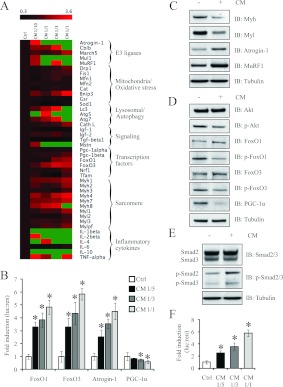
Figure 5. Treatment of C2C12 myotubes with C26 CM activated signalling pathways involved in skeletal muscle wasting.
(A) Heat-map analysis of RT-qPCR results, drawn with Orange Canvas, on a selected set of genes that highlight the anabolic and catabolic components affected when myotubes are treated with 1:1, 1:3, 1:5 and 1:10 dilutions of CM (n=6; numeric values are found in Supplementary Table S3 at http://www.BiochemJ.org/bj/446/bj4460023add.htm). Gene expression was normalized to three endogenous controls, Gapdh, Actb and Hprt using the ΔΔCT method. The green colour in the heat-map represents values with a change above 3.6-fold. Atg, autophagy-related; Bnip3, BCL2/adenovirus E1B interacting protein 3; Cat, catalase; Cath L, cathepsin L; Cblb, Casitas B-lineage lymphoma b; Drp1, dynamin 1-like; Fis1, fission 1; Gsr, glutathione reductase; Lc3, light chain 3; Map1lc3a, microtubule-associated protein 1 LC (light chain) 3α; March5, membrane-associated ring finger (C3HC4) 5; Mfn, mitofusin; Mul1, mitochondrial ubiquitin ligase activator of NF-κB 1; Nrf1, nuclear respiratory factor 1; Sod1, superoxide dismutase 1; Tfam, transcription factor A, mitochondrial. (B) Histogram representing the fold induction (luciferase/Renilla ratio, normalized to the control) of FoxO1, FoxO3, atrogin-1 and PGC-1α promoter–reporter constructs in the presence of 1:1, 1:3 and 1:5 dilutions of CM. n=8; values are means±S.D. (C) Immunoblot analysis of Myh, Myl, atrogin-1 and MuRF1 expression in C2C12 myotubes after treatment with (+) or without (−) CM for 24 h. (D) Immunoblot analysis of FoxO1, p-FoxO1, FoxO3, p-FoxO3, Akt, p-Akt and PGC-1α levels following treatment with (+) or without (−) CM. (E) Immunoblot analysis of Smad2/3 expression and phosphorylation status in C2C12 myotubes after treatment with CM for 24 h. (F) Fold induction (luciferase/Renilla ratio, normalized to control) of a Smad reporter construct possessing 4 SBE (4X SBE) repeats after treatment with 1:1, 1:3 and 1:5 dilutions of CM (bottom). n=8; values are means±S.D. Statistical significance was assessed by Student's t test compared with the control; *P<0.01. Ctrl, control; IB, immunoblot; luc/ren, luciferase/Renilla.

