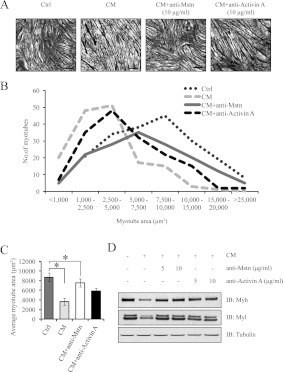
Figure 9. Specific inhibitors of Mstn and activin A reduced C26 CM-induced cancer cachexia.
(A) Haemotoxylin-and-eosin-stained micrographs of C2C12 differentiated myotubes treated for 24 h with low-serum medium (Ctrl), CM, CM pre-incubated with anti-Mstn antibody (CM+anti-Mstn) and CM pre-incubated with anti-activin A antibody (CM+anti-activin A). Scale bars represent 100 μm. (B) The line graph represents the myotube area (μm2) of control, CM-, CM+anti-Mstn- and CM+anti-activin A-treated C2C12 myotubes as calculated by Image Pro Plus. (C) Average myotube area (μm2) of C2C12 myotubes treated with control, CM, CM+anti-Mstn and CM+anti-activin A. (D) Immunoblot analysis of Myh and Myl expression in C2C12 myotubes exposed to control, CM, CM+anti-Mstn and CM+anti-activin A. Statistical significance was assessed by Student's t test compared with the control; *P<0.01. Ctrl, control; IB, immunoblot.

