
Figure 4.
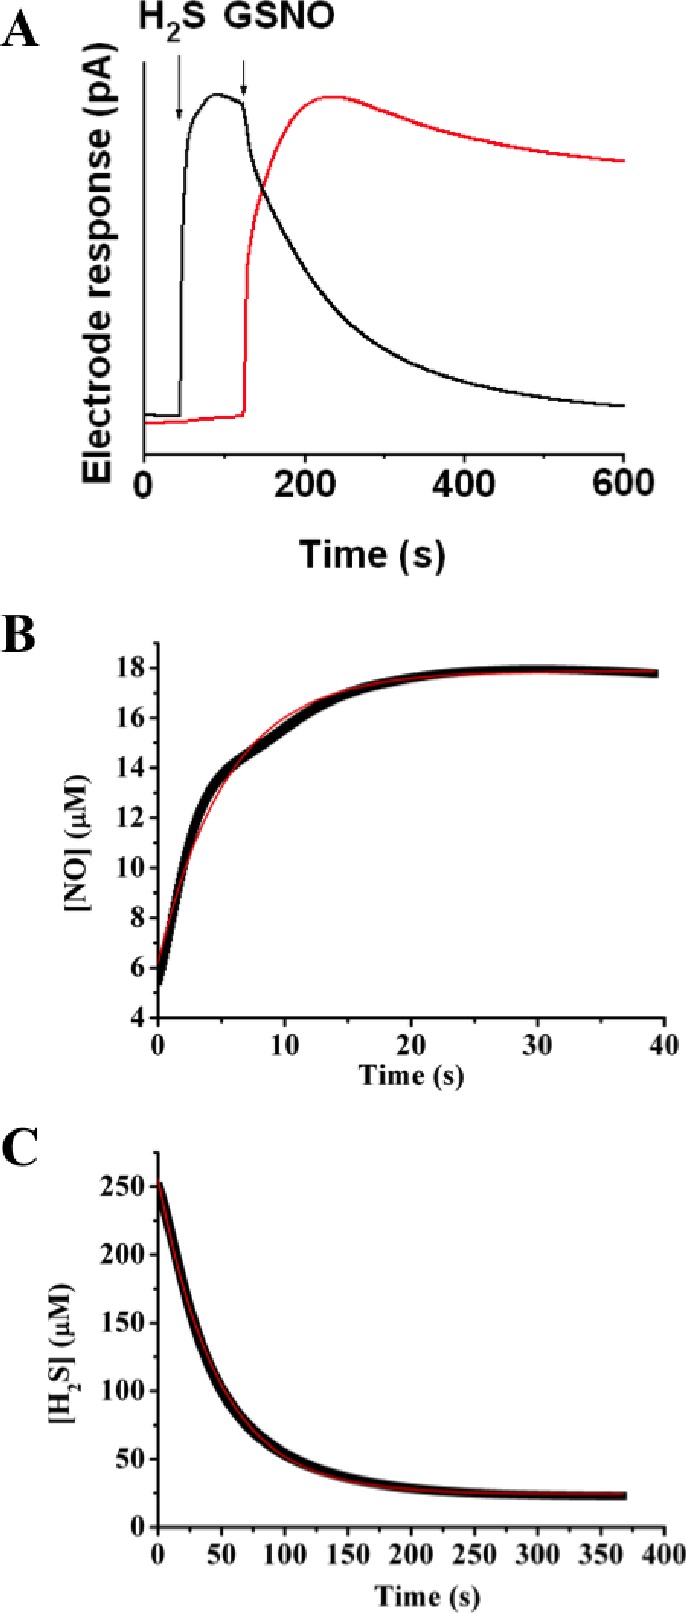
Kinetics of H2S consumption and NO generation in the reaction of GSNO with H2S. (A) Representative recordings by H2S (black) and NO• (red) electrodes, illustrating two processes described by eqs 3 and 4. A 400 μM Na2S solution was prepared in 50 mM potassium phosphate buffer, pH 7.4. When the electrode response reached its maximum, an equimolar amount of GSNO was added, triggering an immediate drop in current at the H2S electrode and a rise in the NO• signal. Kinetic traces of NO• release (B) and H2S consumption (C) from the reaction mixture containing 250 μM GSNO and 250 μM H2S at pH 7.4 at 25 °C. Red lines represent a first-order fit for (B) and a second-order fit for (C).