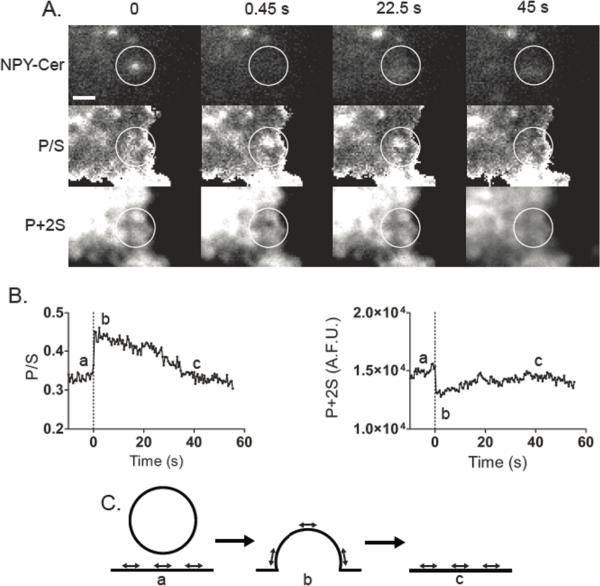
Figure 6. Changes in the topology of the plasma membrane at sites of exocytosis.
(A) P/S and P + 2S images were calculated and aligned to the NPY-Cer image at the times indicated. An NPY-Cer–labeled granule undergoes exocytosis between time 0 and 0.45 s. An increase in pixel intensity in the approximate location of the NPY-Cer image stack is observed, which is consistent with a change in orientation of membrane-intercalated diI. In the P + 2S image, a dimming is observed. Circles are centered over the last observed location of the granule. Bar, 1 μm. (B) Membrane P/S and P+2S were followed for almost 60 s. The dotted line at time 0 indicates the frame before fusion (i.e., the last frame in which the NPY-Cer granule was clearly visible). (C) One possible interpretation of the results in A and B is considered. DiI transition dipole moment orientation is indicated by direction of arrows.

