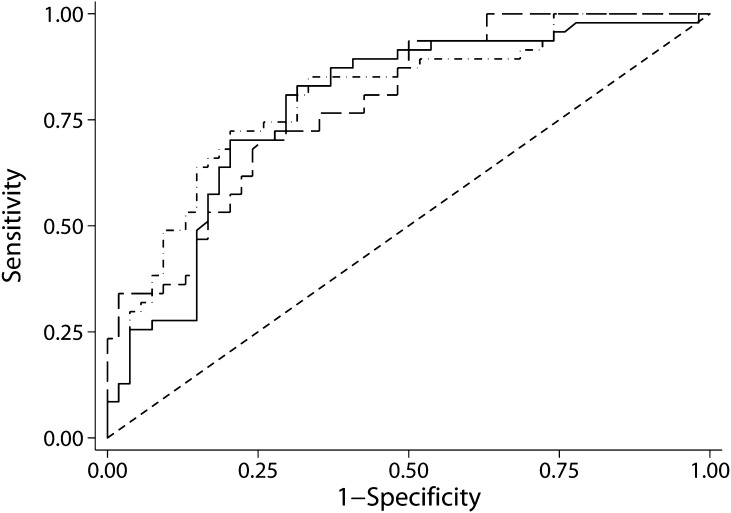
Figure 2.
Receiver-operating characteristic (ROC) curves for the Toronto Risk Score (solid), urinary β2-microglobulin (uβ2m; dots and dashes), and urinary α1-microglobulin (uα1m; long dashes). The ROC areas under the curves (AUCs) for progression were 0.78 (0.69–0.88) for the risk score, 0.80 (0.71–0.89) for uβ2m, and 0.79 (0.71–0.88) for uα1m. None of the areas under the curve differed significantly.

