Figure 2.
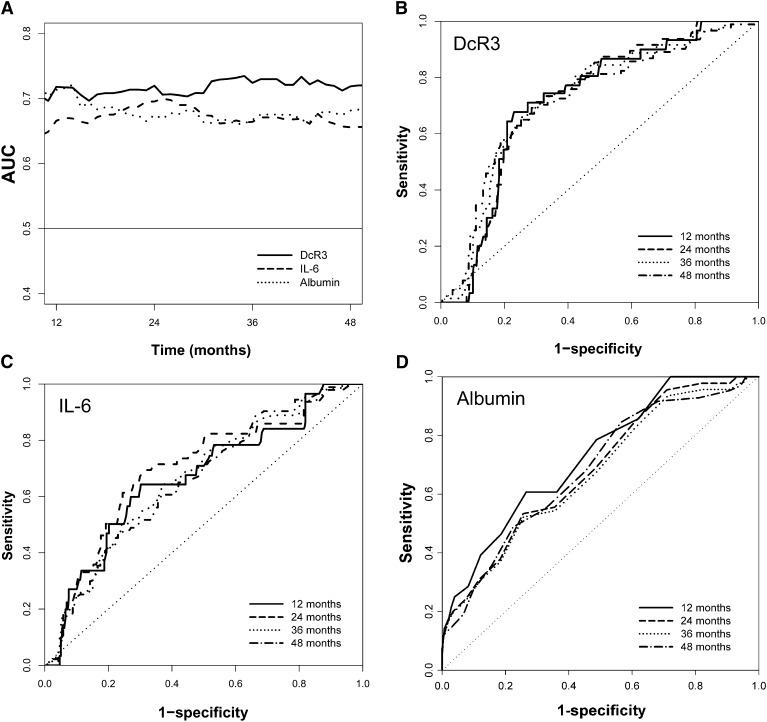
Predictive accuracy of DcR3, IL-6, and albumin estimated by using time-dependent ROC curve analysis. A shows the time-dependent AUCs for all of the markers and B (DcR3), C (IL-6), and D (albumin) show the ROC curves at different time periods. The AUCs at 36 months for DcR3, IL-6, and albumin were 0.74, 0.66 (P<0.01 versus DcR3), and 0.66 (P<0.01 versus DcR3), respectively. The AUCs at 48 month for DcR3, IL-6, and albumin were 0.73, 0.65 (P<0.01 versus DcR3), and 0.68 (P<0.05 versus DcR3), respectively. AUC, area under curve; DcR3, decoy receptor 3; ROC, receiver operating characteristic.

