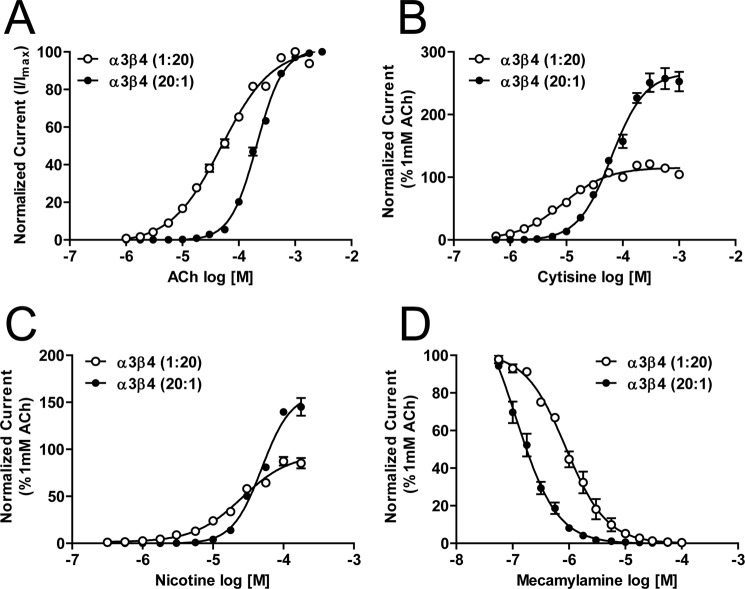
FIGURE 6.
Concentration response profiles for α3β4-only nAChR expressed as loose subunits. Oocytes injected with RNA for α3 and β4 subunits in a 1:20 or 20:1 ratio were perfused with nAChR agonists acetylcholine (10−6 to 10−2, n = 4) (A), cytisine (10−6.25 to 10−3; n = 4) (B), nicotine (10−6.5 to 10−3.5; n = 4) (C), or the nAChR antagonist mecamylamine (10−7.5 to 10−4; n = 4) (D). Data points represent averages (±S.E.). Differences in drug potency and efficacy between groups were analyzed using one-way ANOVA with Tukey's post hoc comparison (see “Experimental Procedures”).

