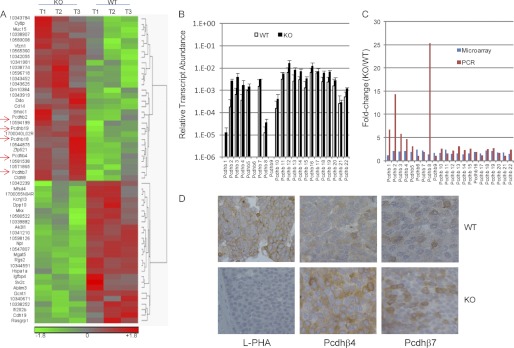
FIGURE 1.
Microarray analysis of gene expression in her-2-induced tumors. A, total RNA was isolated from three wild-type and GnT-V knock-out tumor tissues and used for microarray analysis. A heat map of 57 transcripts differentially expressed (p < 0.05) between wild-type and GnT-V knock-out tumors was generated from the microarray data. Red indicates a high expression level, whereas green indicates a low expression level relative to wild-type. T1–3 represents three tumor tissues collected from three mice with GnT-V wild-type and knock-out backgrounds, respectively. B, total RNA was isolated from two wild-type and two GnT-V knock-out tumors and used for validation of transcript levels of the Pcdhβ cluster by qRT-PCR. For each transcript, the values are normalized to control (Gapdh or Rpl4) and expressed as means with error bars indicating ±1 S.D. C, comparison of -fold change (KO/WT) of transcripts from microarray and qRT-PCR analyses. D, mammary tumor sections from 10-week-old mice were immunostained with leukocytic phytohemagglutinin (L-PHA), anti-Pcdhβ4, and anti-Pcdhβ7, respectively.

