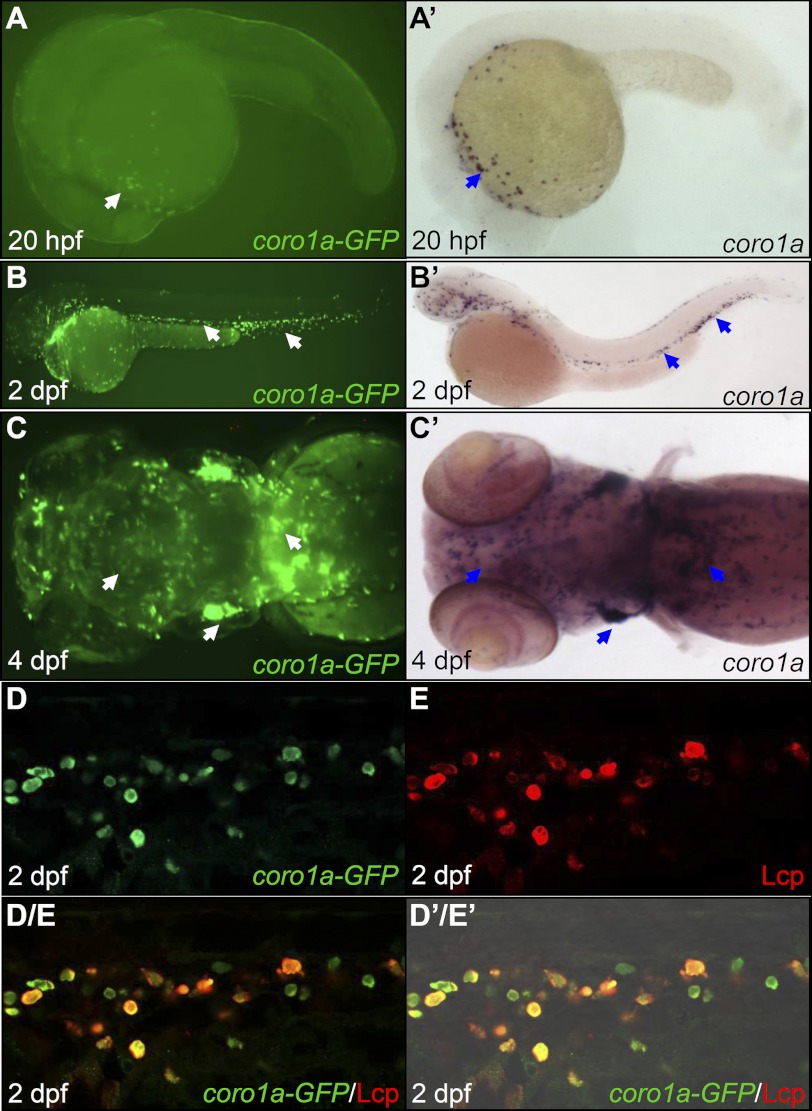
FIGURE 1.
Tg(coro1a:eGFP) marks both macrophages and neutrophils. A–C, fluorescence imaging shows GFP signals in live Tg(coro1a:eGFP) embryos (n = 40/40) in the yolk sac at 20 hpf (A); in the AGM, the CHT, and the circulation at 2 dpf (B); and in the thymus, the kidney, and the brain at 4 dpf (C). A′–C′, WISH reveals coro1a RNA expression in the yolk sac at 20 hpf (n = 40/40) (A′); in the AGM, the CHT, and the circulation at 2 dpf (n = 40/40) (B′); and in the thymus, the kidney, and the brain at 4 dpf (n = 40/40) (C′). White arrows in A–C indicate the GPF+ cells, whereas blue arrows in A′–C′ represent WISH signals. D and E, GFP and Lcp double antibody staining shows the co-localization of coro1a-GFP and Lcp in the CHT of 2 dpf Tg(coro1a:eGFP) embryos (n = 31/31). D/E, superimposed image of D and E. D′/E′, merged view of D/E with the DIC image, AGM, aorta-gonad-mesonephros; CHT, caudal hematopoietic tissue.

