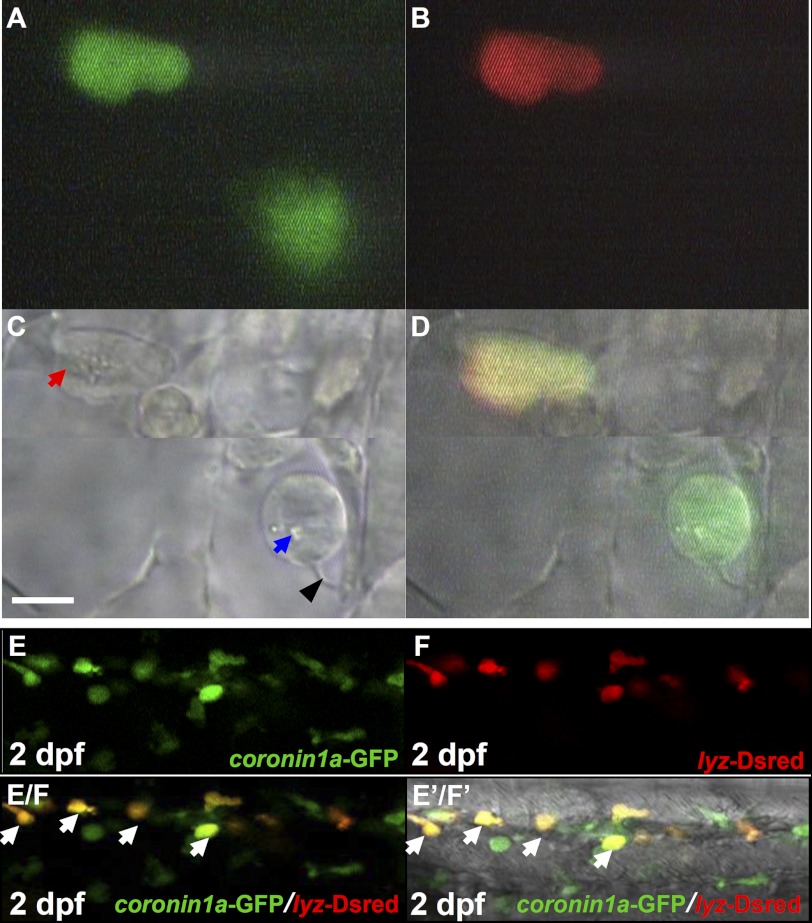
FIGURE 2.
Tg(coro1a:eGFP;lyz:Dsred) distinct macrophages and neutrophils. A–C, live imaging (×60) of two GFP+ cells in 2 dpf Tg(coro1a:eGFP;lyz:Dsred) embryos under a video-enhanced DIC microscope at the GFP channel (A), Dsred channel (B), and bright field (BF) channel (C) (n = 12/12). D, superimposed image of A, B, and C. The blue arrow and black arrowhead in C indicate the lysosome/phagosome inside the macrophage and the long filopodia of macrophage, respectively. The red arrow in C represents granules in neutrophils. Scale bar, 5 μm. E and F, confocal fluorescence imaging (×40) of the CHT region in 2 dpf Tg(coro1a:eGFP;lyz:Dsred) live embryos (n = 40/40) using the GFP (E) and Dsred channel (F), respectively. E/F, superimposed image of E and F. E′/F′, merged view of E/F with the DIC image. White arrows in E/F and E′/F′ represent yellow neutrophils resulting from the merge of GFP and Dsred.

