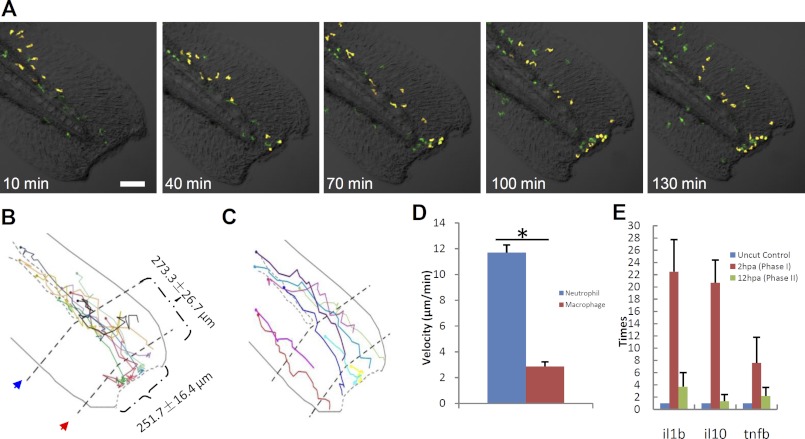
FIGURE 3.
Neutrophil and macrophage behavior upon fin transaction. A, frames of different time points following tail transaction in a 72 hpf Tg(coro1a:eGFP;lyz:Dsred) embryo (green, macrophages; yellow, neutrophils). Scale bar, 100 μm. B and C, schematic diagrams show the wound size and cell migration trajectory of the first 10 neutrophils (B) and nine macrophages (C) to arrive at the wound, followed for 5 h after tail transaction. The circle in the end of each trajectory line represents the initial site of each myeloid phagocyte. The red arrow indicates the first line near the cut edge, which is the end of the notochord, and the blue arrow represents the second line, which is the end of circulation. The dotted curved lines in B and C represent vessels. D, histogram reveals that the velocity of neutrophils is much faster than macrophages during the process toward the wound edge (n ≥ 9, mean ± S.E. (error bars)). *, statistical differences with corresponding control (t test, p < 0.05). E, histogram showing that the RNA level of cytokines increased dramatically in inflammatory stage but decreased thereafter until the regeneration stage (n = 42).

