FIGURE 4.
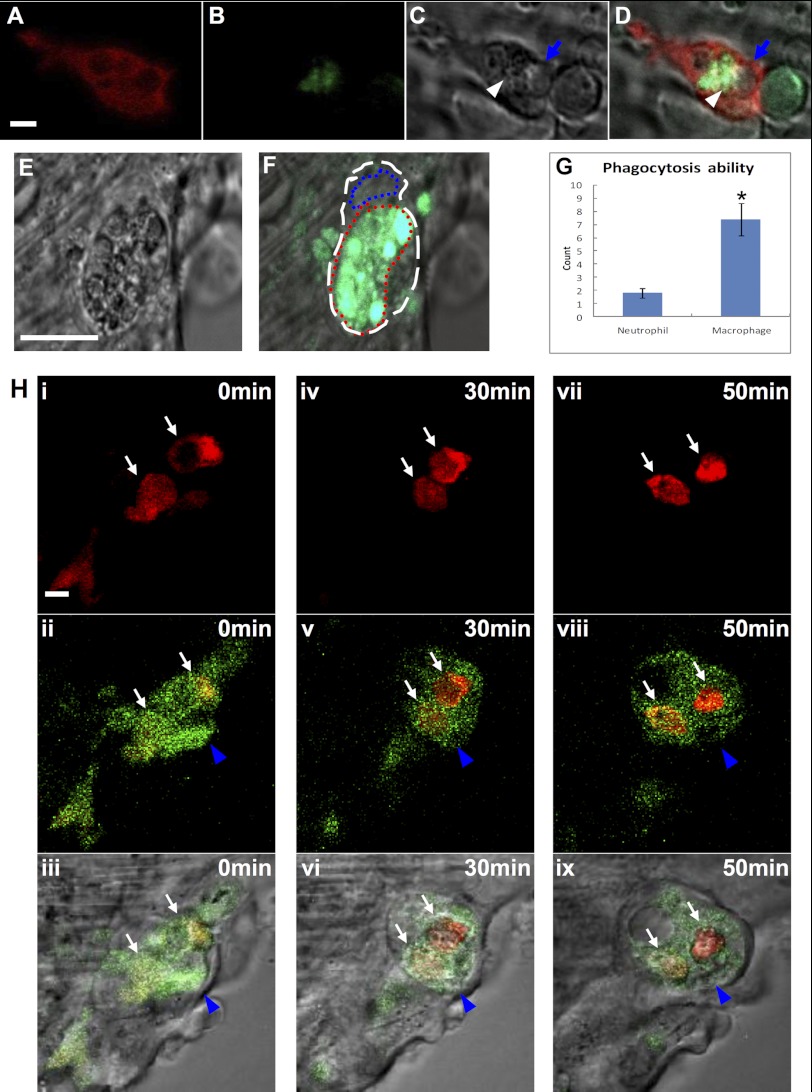
Macrophages and neutrophils behaviors in the wound after amputation. A–D, live imaging (×40) shows that lyz+ neutrophils engulf both AO+ particle cell debris and AO− vacuolar cell debris at 2 hpa (n = 13). The white arrowhead and blue arrow indicate the AO+ particle and AO− vacuolar cell debris, respectively. Scale bar, 1 μm. E and F, live imaging (×40) reveals a macrophage with a large amount of cell debris (E, n = 12), including AO+ particles (green) (F, n = 12). The white and blue dashed lines indicate the shape and the nucleus of macrophage, respectively, whereas the red dashed line manifests the large vacuole full of ingested debris. Scale bar, 10 μm. G, histogram reveals the phagocytosis ability (represented by the number of dead particles ingested) of macrophages and neutrophils (n = 12, mean ± S.E. (error bars)). The asterisk in G indicates statistical differences with corresponding control (t test, p < 0.05). H, frames (×100) of different time points of two neutrophils (indicated by white arrows) engulfed by a macrophage (represented by blue arrowheads) in a 72 hpf Tg(coro1a:eGFP;lyz:Dsred) embryo (n = 7). The bottom panels are merges of DIC with the middle panels. Scale bar, 1 μm.

