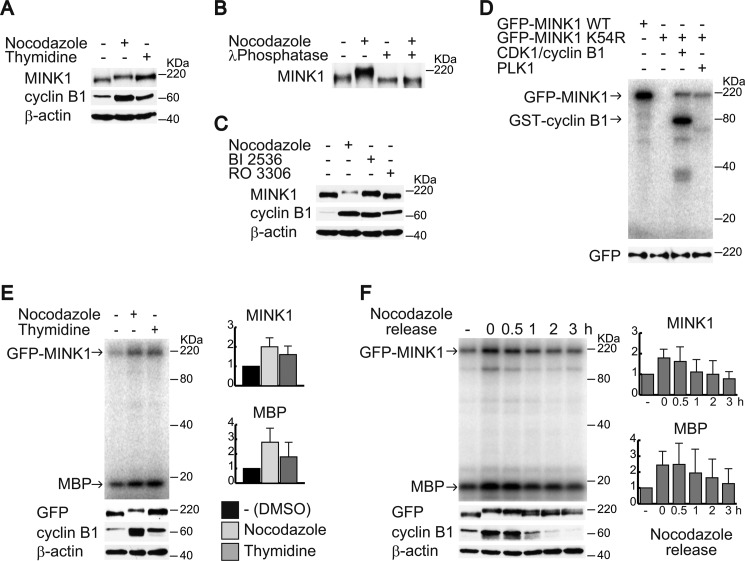
FIGURE 3.
MINK1 is phosphorylated in mitosis. A, HeLa cells were synchronized in mitosis by nocodazole arrest or thymidine release. The cells were lysed, and the lysates were immunoblotted with the indicated antibodies. B, cells were treated or not treated with nocodazole for 16 h, lysed, and MINK1 was immunoprecipitated. The immunoprecipitates were incubated with or without lambda phosphatase and then immunoblotted with anti-MINK1 antibody. C, cells were treated with nocodazole, BI2536 (PLK1 inhibitor), or RO3306 (CDK1 inhibitor), and then the cell lysates were immunoblotted with the indicated antibodies. D, phosphorylation of GFP-MINK1 by PLK1 and CDK1/cyclin B1 was examined by an in vitro kinase assay. Catalytically inactive GFP-MINK1 (K54R) was used as a substrate. An immunoblot of anti-GFP antibody shows equal amounts of substrates were used for the assay. E, HeLa cells that constitutively expressed GFP-MINK1 were synchronized in mitosis by nocodazole arrest or thymidine release. The cells were lysed, immunoprecipitated with anti-GFP antibody, and then subjected to the in vitro kinase assay. A portion of cell lysates (cyclin B1 and β-actin) and immunoprecipitated GFP-MINK1 were subjected to immunoblot with the indicated antibodies. Note that phosphorylated MINK1 in the in vitro kinase assay does not show a mobility shift because a 12.5% acrylamide gel was used. The graphs show relative band intensities of phosphorylated GFP-MINK1 and MBP normalized by the amount of immunoprecipitated GFP-MINK1. The data are represented as mean ± S.D. from three independent experiments. F, HeLa cells that constitutively expressed GFP-MINK1 were synchronized in mitosis by nocodazole and released. The cells were lysed at the indicated time point, and immunoprecipitated GFP-MINK1 was subjected to the in vitro kinase assay. A portion of cell lysates (cyclin B1 and β-actin) and immunoprecipitated GFP-MINK1 were subjected to immunoblot with the indicated antibodies. The graphs show relative band intensities of phosphorylated GFP-MINK1 and MBP normalized by the amount of immunoprecipitated GFP-MINK1. The data are represented as mean ± S.D. from three independent experiments.

