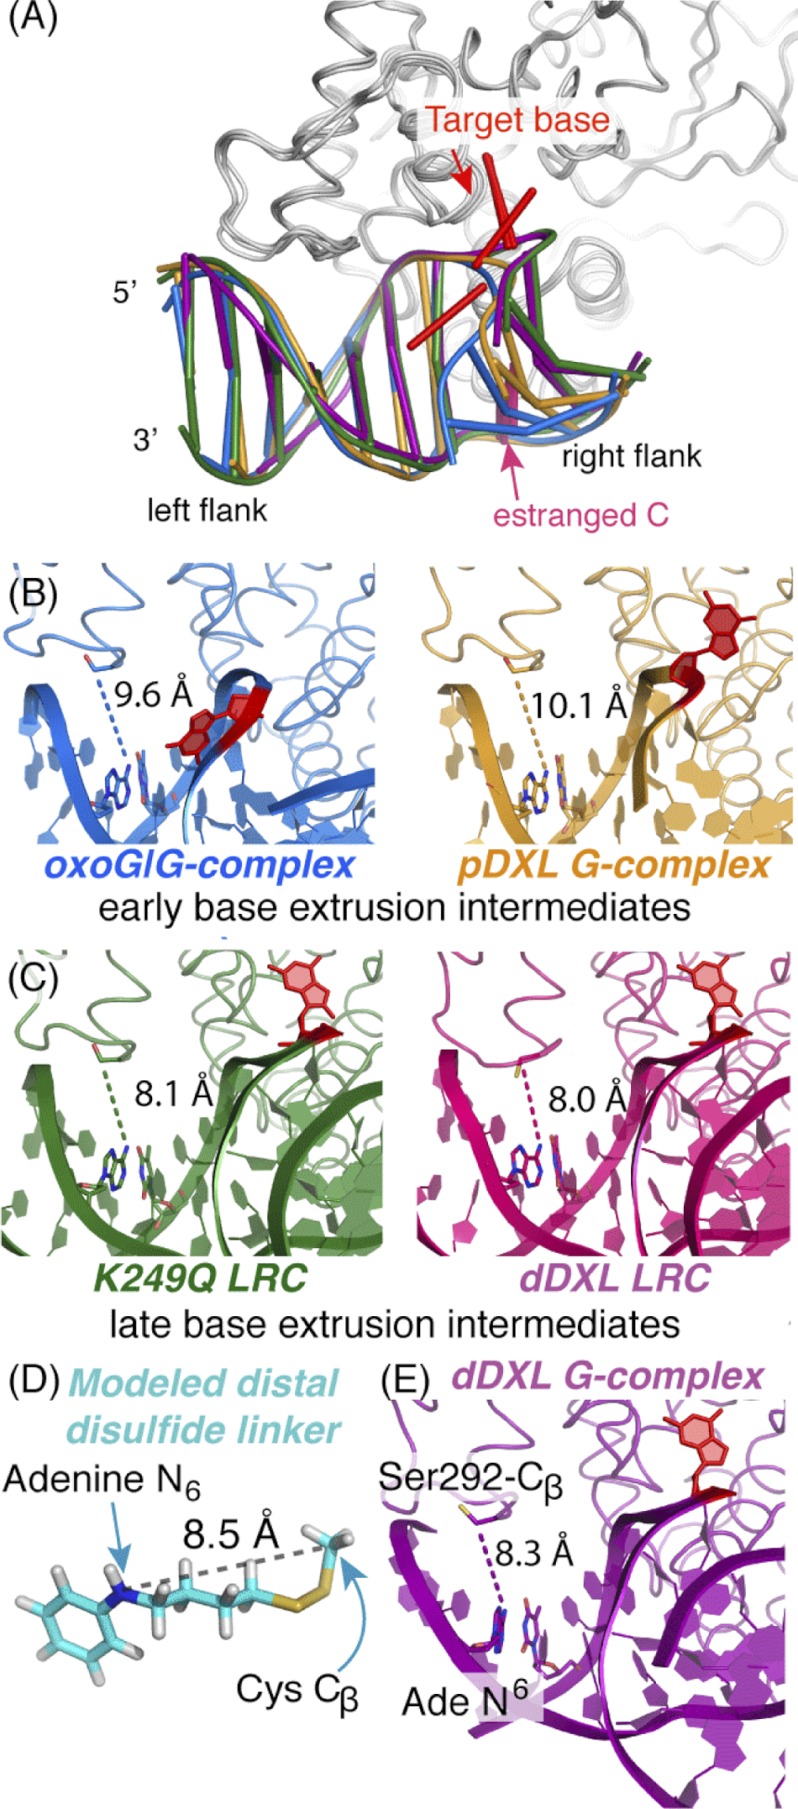
FIGURE 6.
Structural snapshots along the hOGG1 nucleobase extrusion pathway. Shown are representations of hOGG1-DNA complexes representing various stages along the nucleobase extrusion pathway: blue, the oxoG·G-complex (2I5W (42)), representing an early intermediate; orange, the pDXL G-complex (1YQK (34)), a later intermediate; the K249Q LRC in the absence (green, 1EBM (13)) and presence (hot pink, 2NOL (43)) of distal site cross-linking, representing the final state preceding catalysis; and purple, the dDXL G-complex (3IH7, this work). A, comparison of adjustments in the DNA component of the protein-DNA complexes. This structural comparison was generated by least-squares superposition of the protein component (residues 12–300) using the program Coot (48). The left flank of the DNA bears the distal cross-linking site; note the shift in position as a function of progression along the nucleobase extrusion pathway. The target base is colored red and the estranged C is light magenta. B, model of the lowest energy conformation for the four-carbon disulfide-bearing tether used in distal cross-linking of hOGG1 to DNA. Denoted explicitly is the distance (8.5 Å) between the atoms corresponding to the N6 atom of the tethered adenine and the β-carbon of Cys-292 (the adenine ring is replaced by benzene in the model. See supplemental Fig. S4, legend for details of the minimization procedure and the entire ensemble of conformers. Note that the lowest energy conformation extends the longest distance of all the stable conformers.) C–E, a comparison of distances between the adenine N6 to the Cβ of residue 292 in structures of hOGG1-DNA complexes at various stages of the nucleobase extrusion pathway. In all cases, the protein is displayed as a ribbon and the DNA is shown in schematic representations. The side chain of residue 292, the tethered adenine, and its thymine partner are colored by atom and shown as stick models, as is the target base, in which all atoms are colored red. D, complexes of hOGG1 in which the target base is partially extruded are termed early base extrusion intermediates. The distal site distances tend to be longer on average than those of LRCs (E), which represent late base extrusion intermediates. The DNA ladder representation was generated using X3DNA (66), nuccyl, and PyMol (50).

