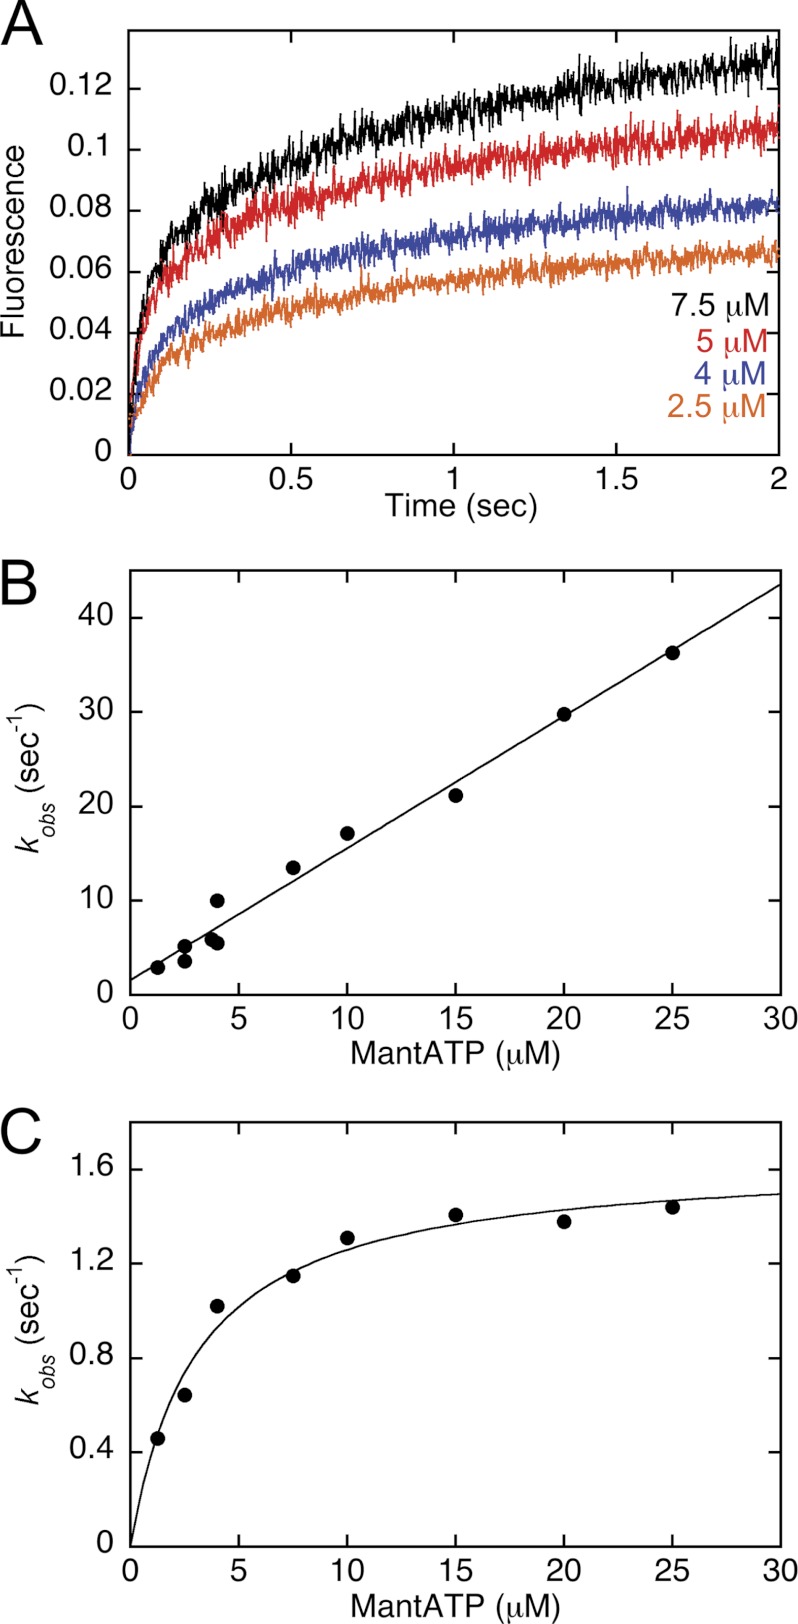
FIGURE 1.
MantATP binding kinetics. The nucleotide-free MT·CENP-E complex was rapidly mixed in the stopped-flow instrument with increasing concentrations of mantATP. A, representative transients at 2.5, 4, 5, and 7.5 μm mantATP (bottom to top) show an exponential increase in fluorescence as a function of time. Final concentrations: 2.5 μm CENP-E, 7.5 μm MTs. B, the observed rates of the initial exponential phase were plotted as a function of mantATP concentration, and the linear fit of the data provided k+1 = 1.4 ± 0.06 μm−1 s−1 and k−1 = 1.6 ± 0.7 s−1. C, the observed rates of the second exponential phase were plotted as a function of mantATP concentration, and the hyperbolic fit of the data provided kmax = 1.6 ± 0.06 s−1 and K½,mantATP = 3.1 ± 0.4 μm. Final concentrations: 2.5 μm CENP-E/7.5 μm MTs for 1.25–7.5 μm mantATP and 4 μm CENP-E/7.5 μm MTs for 2.5–25 μm mantATP.

