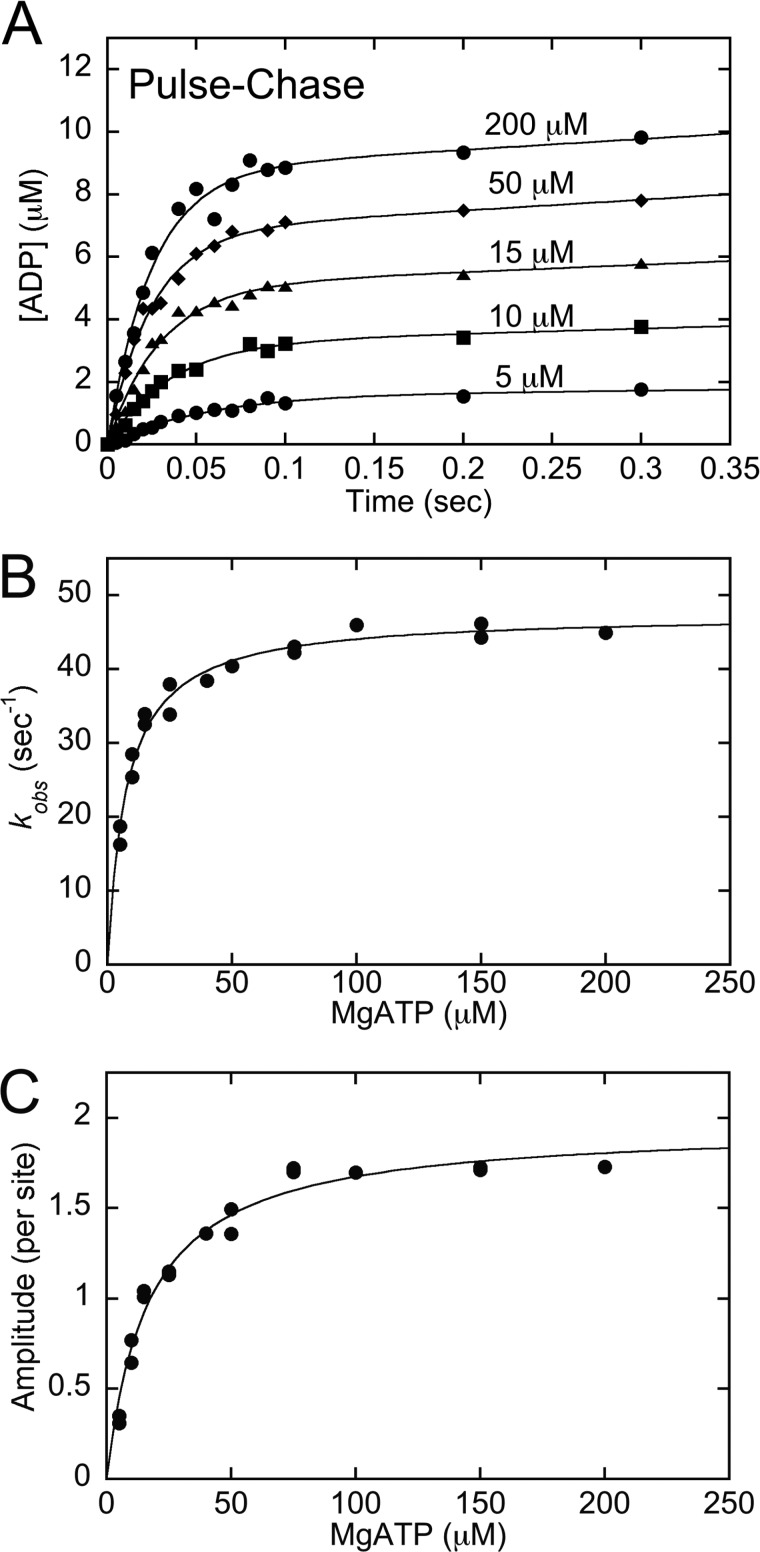
FIGURE 2.
Kinetics of ATP binding by pulse-chase. The MT·CENP-E complex was rapidly mixed with increasing concentrations of [α-32P]ATP + KCl in a chemical quench-flow instrument followed by a nonradiolabeled ATP chase. Final concentrations: 5 μm CENP-E, 15 μm MTs, 5–200 μm [α-32P]ATP, 100 mm KCl. A, representative transients show an exponential increase of [α-32P]ADP·Pi product formation during the first ATP turnover followed by a linear phase of product formation. B, the observed rates of the initial exponential phase were plotted as a function of ATP concentration, and the fit of the data to Equation 3 provided K1 = 0.13 ± 0.01 μm−1, k+1′ = 47.5 ± 0.8 s−1 with K1k+1′ = 6.2 μm−1 s−1 and Kd,ATP = 7.7 μm. C, the amplitudes of the pre-steady-state exponential burst phase were plotted as a function of ATP concentration, and the hyperbolic fit of the data provided Amax = 1.96 ± 0.1 ADP·Pi/site with apparent Kd,ATP = 16.7 ± 1.7 μm. Data shown in panels B and C are from multiple experiments.

