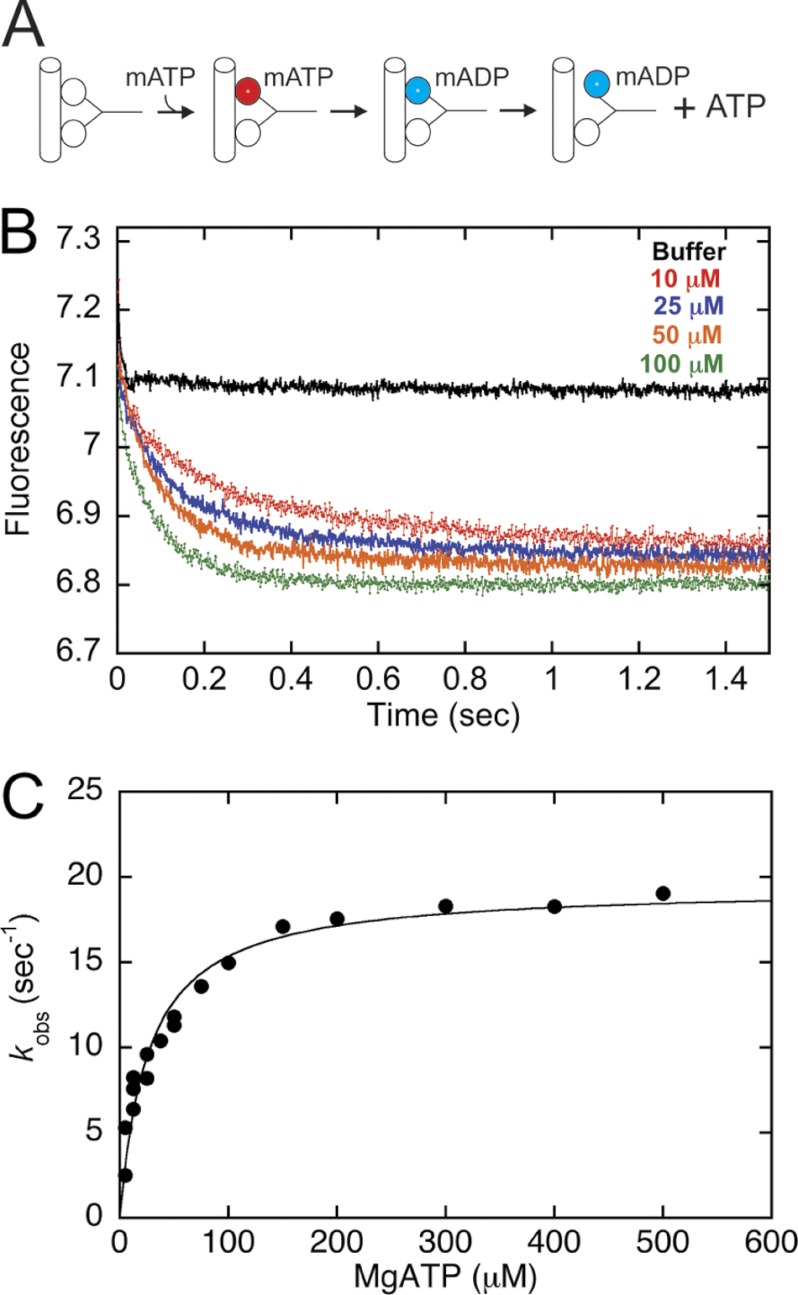
FIGURE 4.
ATP-triggered mantADP release kinetics. A preformed MT·CENP-E·mantADP (mADP) complex was rapidly mixed in the stopped-flow instrument with ATP. Final concentrations: 5 μm CENP-E, 10 μm MTs, 2 μm mantATP (mATP), 5–500 μm ATP. A, experimental design to establish the processive stepping intermediate. B, representative transients at 0, 10, 25, 50, 100 μm ATP (top to bottom). C, the observed rates of the initial exponential phase were plotted as a function of ATP concentration, and the hyperbolic fit of the data provided kmax = 19.4 ± 0.6 s−1, K½,ATP = 26.6 ± 3.2 μm.

