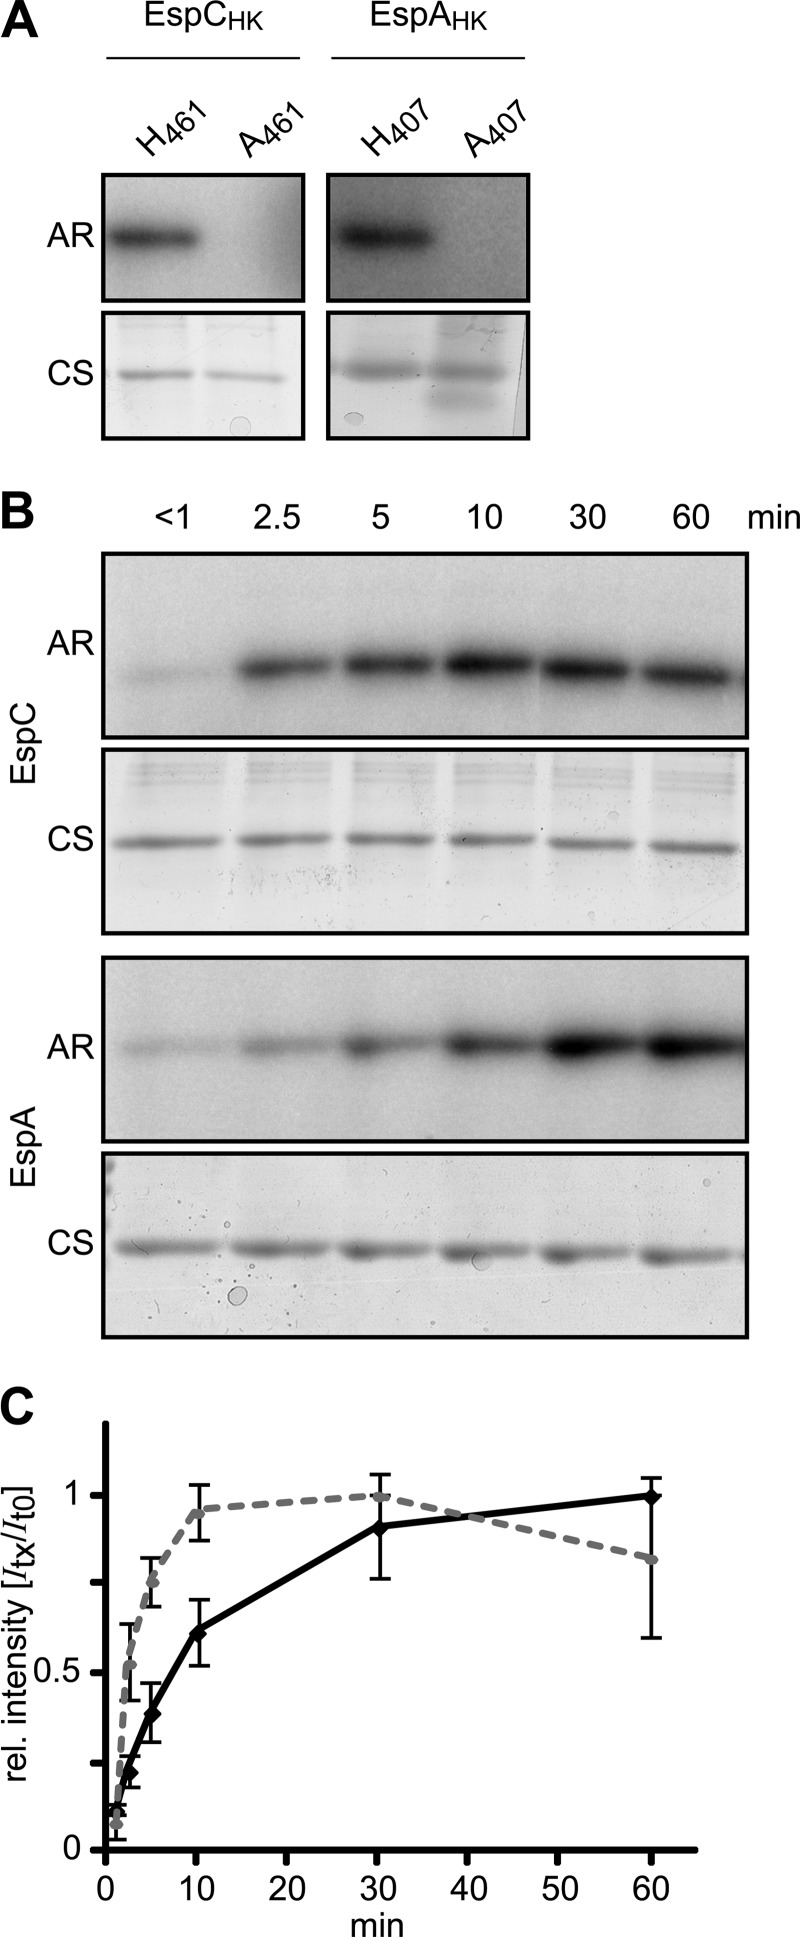
FIGURE 4.
EspC kinase region autophosphorylates in vitro. A, in vitro autophosphorylation of EspAHK-His6, EspCHK-His6, EspAHK H407A-His6, and EspCHK H461A-His6. 10 μm of each recombinant protein was incubated in the presence of [γ-32P]ATP for 60 min, quenched, and resolved by SDS-PAGE, and the radiolabel was detected by exposure to a Storage PhosphoScreen (AR). Total protein was subsequently detected by Coomassie stain (CS). B, relative in vitro autophosphorylation rates of EspC and EspA kinase regions. 10 μm EspAHK-His6 or EspCHK-His6 was incubated in the presence of [γ-32P]ATP; aliquots were removed at the indicated time points and analyzed as above. C, quantification of EspC (dashed line) and EspA (solid line) HK autophosphorylation rates in B. Relative (rel.) signal intensities of the bands from three independent time courses were quantified and normalized to the maximal signal intensity of each protein. The average relative signal intensity and associated standard deviation from each time point was plotted.

