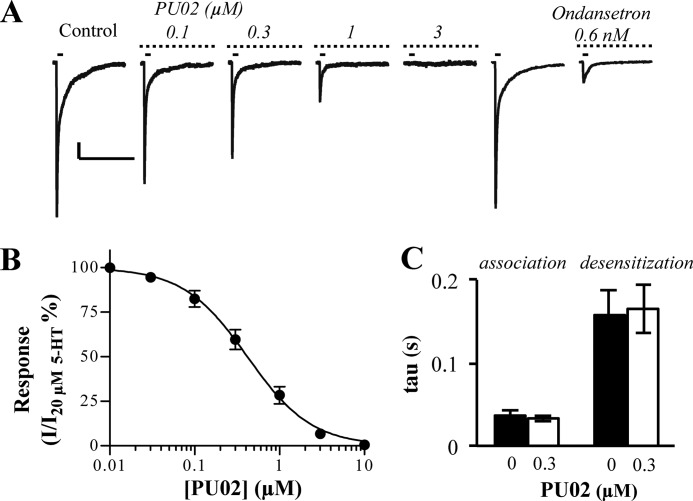
FIGURE 3.
Electrophysiological characterization of PU02 at the 5-HT3A receptor expressed in COS-7 cells. A, currents induced by 20 μm 5-HT (∼EC70–80) pulses (solid bar, 45-s interval) were inhibited by PU02 (dotted bar). Scale bars, 200 pA (vertical) and 5 s (horizontal). Peak current amplitudes induced by 20 μm 5-HT in the presence of PU02 were base line-subtracted and normalized to those in absence of antagonist. B, concentration-inhibition curve for PU02. Data are given as mean ± S.E. values (error bars) based on 5–6 cells on at least three different days and transfections. C, association (current rise) and desensitization (current decay) time constants (τ values) for the 5-HT response in the absence or presence of 0.3 μm PU02 were calculated by fitting either phase of selected currents to applicable single exponential equations.

