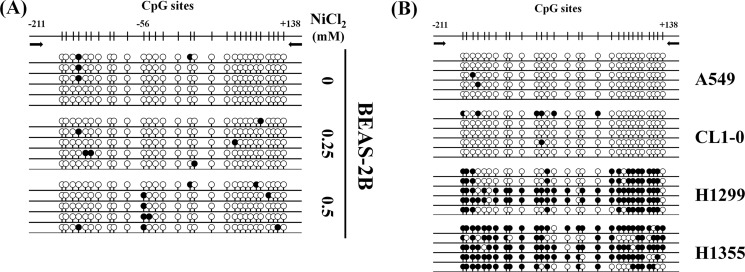
FIGURE 7.
Bisulfite genomic sequencing of E-cadherin promoter (−211 to +138). Methylation status of CpG sites around the E-cadherin promoter region was analyzed in BEAS-2B cell line following treatment with NiCl2 (0, 0.25, and 0.5 mm) (A) and lung cancer cell lines (A549, CL1-0, H1299, and H1355 cells) (B). Region spans −211 to +138 including 29 CpG sites. Each row represents an individual subclone. White circles represent unmethylated CpGs. Black circles represent methylated CpGs.

