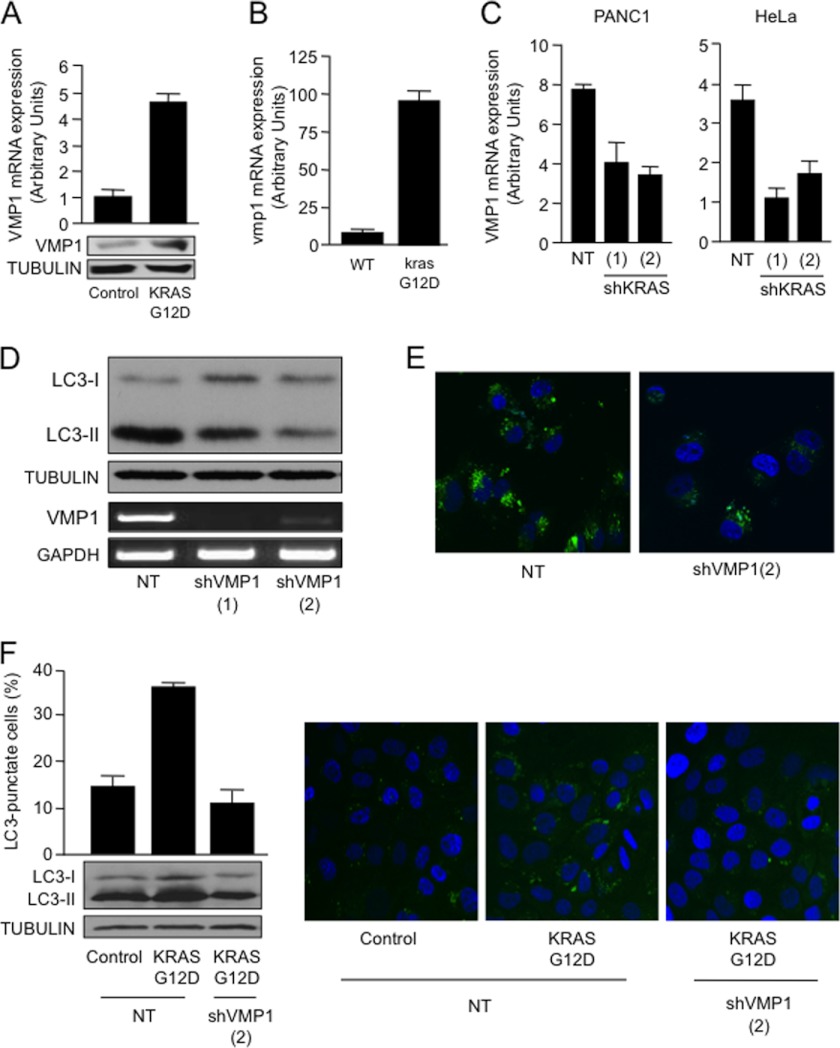
FIGURE 2.
A, HeLa cells were transfected with KRASG12D for 48 h, and RNA was subsequently extracted. VMP1 expression levels were determined by real-time RT-PCR (upper panel) and Western blot (lower panel). B, RNA was isolated from wild-type and krasG12D murine pancreatic tissue at 9 months and used to determine expression of vmp1 relative to 18 S by real-time RT-PCR. C, VMP1 mRNA expression levels were determined by real-time RT-PCR in PANC1 and HeLa cells transfected with shKRAS constructs or NT control vector. D, LC3-II expression by Western blot in PANC1 cells carrying an oncogenic mutant KRASG12D transfected with two independent VMP1 shRNA constructs or a non-targeting control vector. VMP1 mRNA expression levels by RT-PCR were included as a control of knockdown efficiency. E, EGFP-LC3 distribution in PANC1 cells co-transfected with VMP1 shRNA or non-targeting control. F, Western blot for LC3-II in MCF10A cells transfected with VMP1 shRNA and either a control vector or KRASG12D (lower left panel). MCF10A cells were transfected with EGFP-LC3 and with KRASG12D or control vector in the presence or absence of VMP1 shRNA. Left, the percentage of autophagic cells with punctate EGFP-LC3 fluorescence was calculated relative to all EGFP-positive cells. Right, a representative punctate EGFP-LC3 fluorescence by confocal microscopy.

