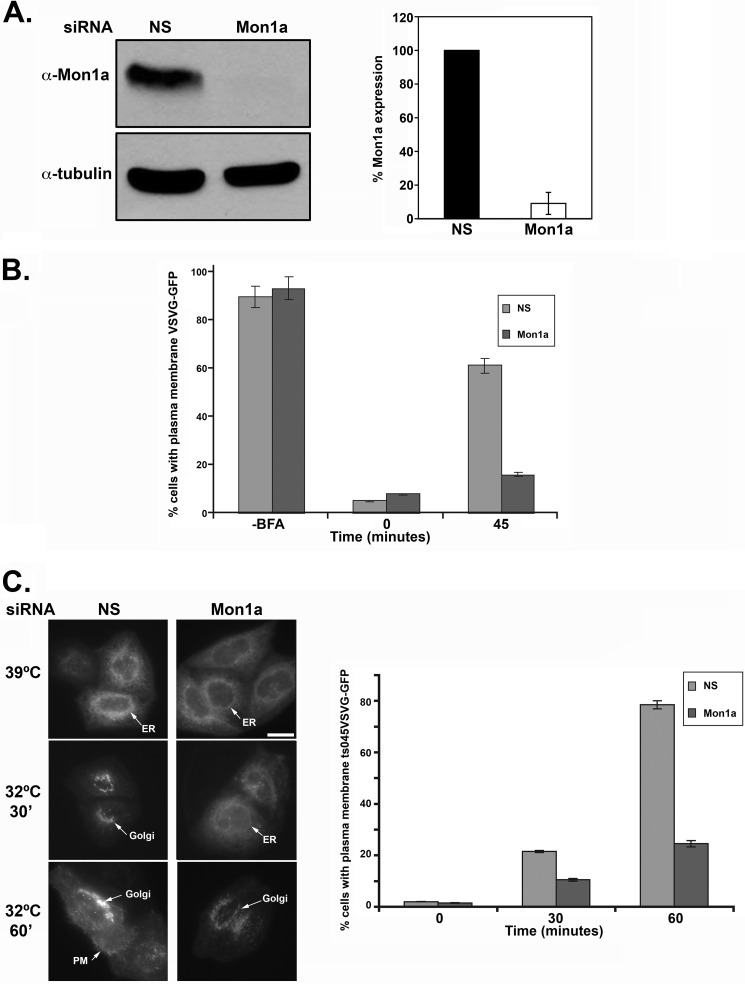
FIGURE 1.
Trafficking of VSVG-GFP is delayed in Mon1a-silenced cells. A, NIH3T3 cells expressing VSVG-GFP were silenced with nonspecific (NS) or Mon1a specific oligonucleotide pools for 48–72 h. Cells were lysed, and the levels of Mon1a and tubulin were assessed by Western blot. A representative blot is shown with the graph representing the average knockdown from n = 3 blots. Error bars represent the S.E. B, cells as in A were treated with 5 μg/ml BFA for 30 min at 37 °C, BFA was removed, cells were placed in DMEM at 37 °C, and VSVG-GFP trafficking to the plasma membrane was assessed by epifluorescence microscopy. The data are expressed as the percentage of cells showing VSVG-GFP localization at the plasma membrane −BFA, +BFA (time 0), and 45 minutes, examining localization with 50–100 cells per sample counted. Error bars represent the S.E. C, cells silenced for Mon1a were transfected with ts045VSVG-GFP and maintained at the restrictive temperature (39 °C). Cells were moved to the permissive temperature (32 °C), and movement of ts045VSVG-GFP to the plasma membrane over time was assessed by fluorescent microscopy. Representative images at 39 °C, 32 °C 30 min and 32 °C 60 min are shown. Scale bar = 10 μm. Arrows denote reticular ER, Golgi, or plasma membrane (PM). Images were analyzed and quantified by three separate individuals. The data are expressed as the percentage of cells showing ts045VSVG-GFP at the plasma membrane as described under ‘Experimental Procedures.’ All experiments were performed a minimum of five times. Error bars represent the S.E.

