FIGURE 2.
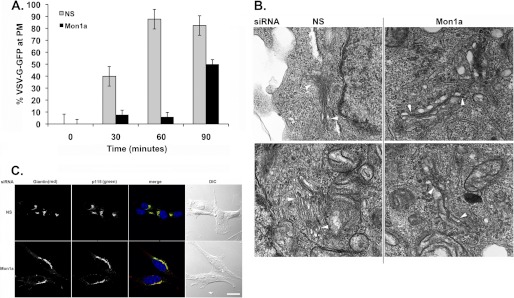
Reductions in Mon1a alter Golgi morphology. A, cells as in Fig. 1C were shifted from 39 to 15 °C to allow all ts045VSVG-GFP to accumulate in the Golgi (4–8 h). Cells were then shifted to 24 °C to allow movement of ts045VSVG-GFP to the plasma membrane (PM), and images were captured over time. The data are expressed as the percentage at the plasma membrane. All experiments were performed a minimum of three times. Error bars represent the S.E. NS, nonspecific. B, cells silenced as in A were processed for EM as described under ‘Experimental Procedures.’ Magnification = 70,000×. Arrowheads identify Golgi structures in nonspecifically (NS) or Mon1a-silenced cells. C, mouse fibroblasts were silenced with nonspecific or mouse Mon1a-specific oligonucleotides for 96 h, fixed, and processed for immunofluorescence using rabbit anti-Giantin or mouse anti-p115. Images were captured on an Olympus FV1000 confocal microscope. Representative images are shown from n = 3 separate experiments. Scale bar = 10 μm. Arrows denote altered Golgi structures in Mon1a-silenced cells.

