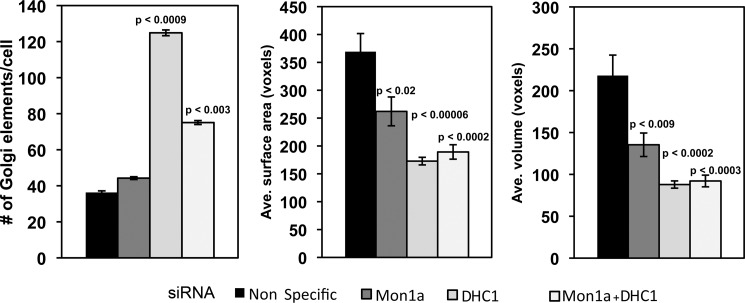
FIGURE 6.
Volocity analysis and quantification of changes in Golgi morphology in Mon1a, dynein heavy chain, or Mon1a + dynein heavy chain silenced cells. Cells silenced as in Fig. 5 were imaged using confocal microscopy, and images were quantified using the Volocity software. The Golgi-labeled channel was quantified by setting the lower size cutoff limit at 10 cubic voxels, which is just above the minimum optically resolvable volume to filter out digital noise. Cells were cropped out of the image and measured individually to get cell-by-cell data. Signal was thresholded using the same intensity values for all silenced groups. The data are expressed as the number of Golgi elements/cell, and the average (Ave.) Golgi surface area and average Golgi volume are expressed as voxels (cubic pixel area). All experiments were performed a minimum of three times. Error bars represent the S.E. p values were determined using a two-tailed Student's t test statistical analysis comparing them with the nonspecifically silenced cells.

