
Figure 2.
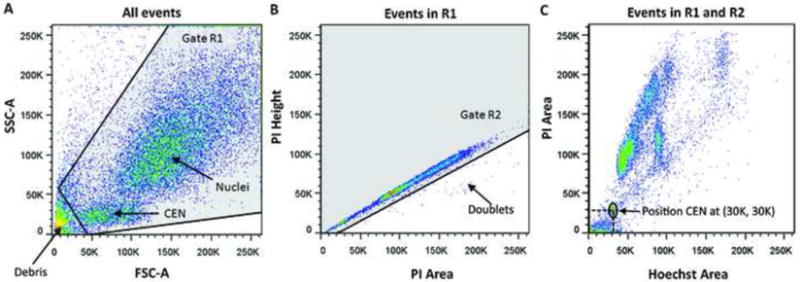
(A) Side scatter vs. forward scatter plot shows the position of nuclei, CEN and debris. All events in gate R1 are to be included in the data collection and analysis steps; (B) PI-Height vs. PI-Area plot shows the doublet events below the diagonal that must be excluded. Events in gate R2 are included in the data collection and analysis steps; (C) PI-Area vs. Hoechst-Area plot of events included in gates R1 and R2. PI and Hoechst channel voltages must be adjusted to position CEN at (30K, 30K) or any other practical coordinates for all samples.