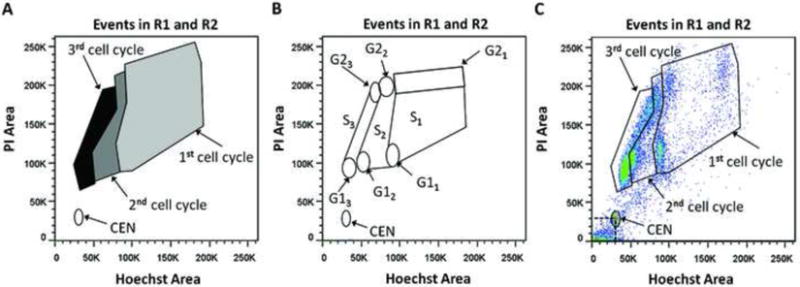
Figure 3.

(A) PI-Area vs. Hoechst-Area plot showing the regions that would contain nuclei in the first cell cycle (CC1)- light grey, second cell cycle (CC2)- dark grey, third cell cycle (CC3) black; (B) Plot showing the G1, S and G2 populations for each cell cycle. G11, S1, G21 are G1, S and G2 in cell cycle 1 and so on; (C) Example of a sample for which the CEN and cell cycle gates have been drawn.
