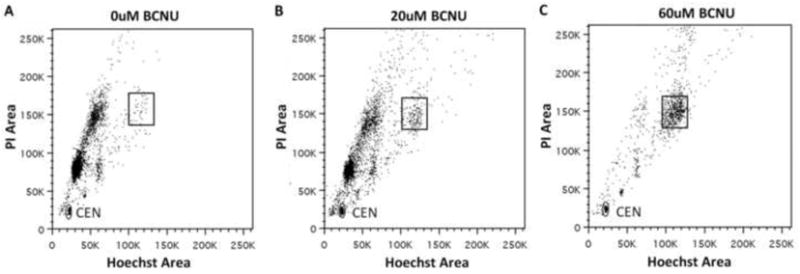
Figure 6.

U87MG cells show increasing accumulation of cells in late S/G2 with increasing BCNU doses of 0μM, 20μM and 60μM (A, B and C respectively). The box in the figures marks the area corresponding to the late S/G2 region of the first cell cycle which has approximately double the value of Hoechst and PI fluorescence as compared to the region containing the G1 cells in the first cell cycle seen in panel A.
