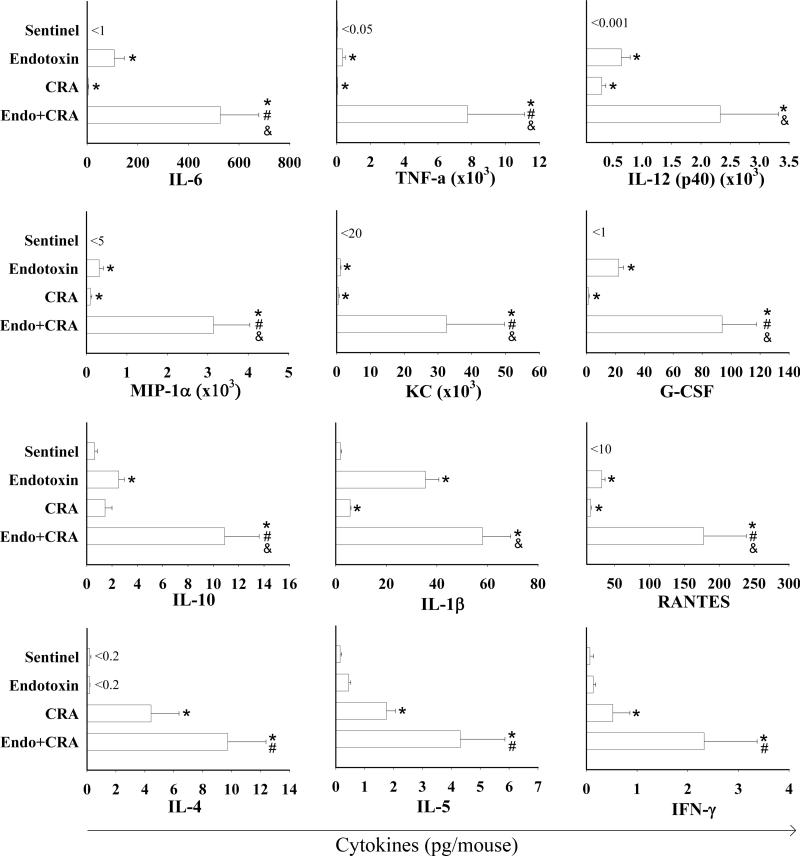
Figure 2.
Cytokines and chemokines (pg/mouse) measured in BAL fluid of young mice exposed to inhaled endotoxin, cockroach allergen (CRA) and the mixture of endotoxin and CRA. Data are expressed as mean + SEM. Symbols are: < below the indicated level of detection; * P<0.05 compared with Sentinels; # P<0.05 compared with Endotoxin; & P<0.05 compared with CRA Group.

