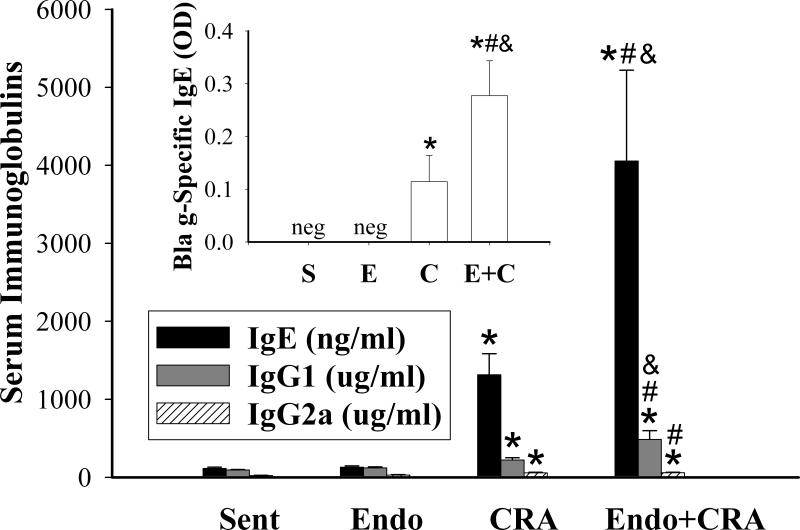
Figure 3.
Levels of immunoglobulins (total IgE, IgG1, and IgG2a), in serum of mice exposed by inhalation to endotoxin, cockroach allergen, or mixture of the two. Inset: cockroach allergen-specific IgE in serum. Data are expressed as mean + SEM. Symbols are: neg = negative; * P<0.01, compared with Sentinels (S); # P<0.05 compared with Endotoxin (E); & P<0.05, compared with Cockroach Allergen Group (CRA).

