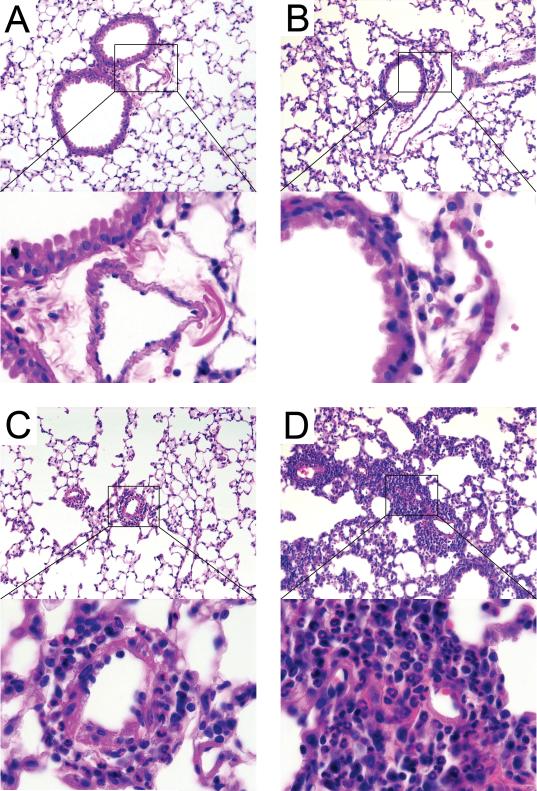
Figure 4.
Representative photomicrographs of lung sections from an animal of each treatment group. Areas selected by the rectangle are shown at higher magnification (magnifications 20X and 100X, respectively). A – Sentinels; B – Endotoxin induced peribronchiolar (open arrow) neutrophilic infiltrates; C – Cockroach allergen induced predominantly perivascular (closed arrow) eosinophilic infiltrates; D – Mixture of endotoxin and cockroach allergen induced thick focal, both perivascular and peribronchiolar inflammatory infiltrates. H&E staining.

