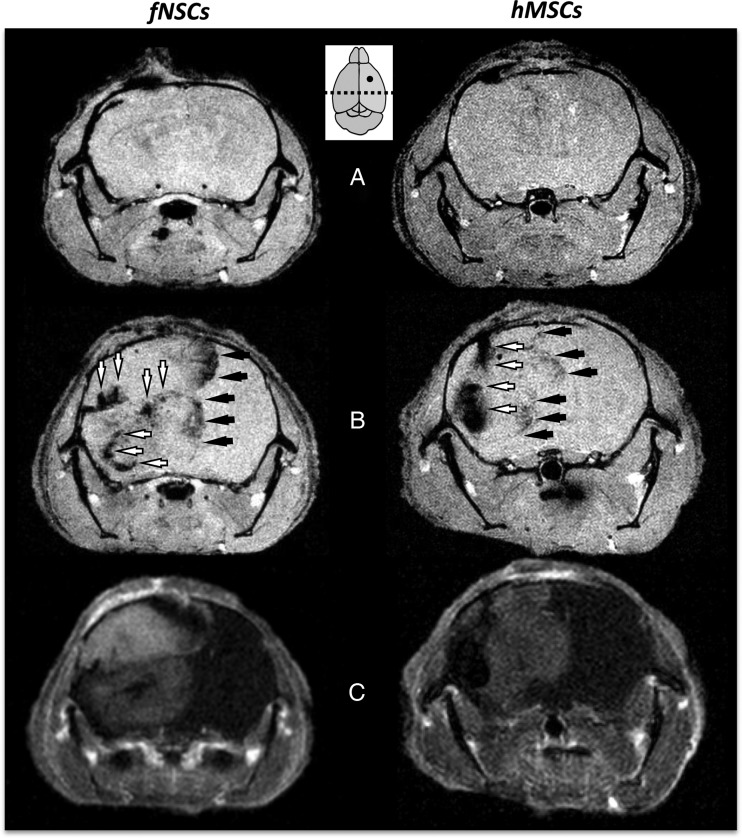
Fig. 4.
Biodistribution of MPIO-labeled hMSCS and fNSCs in U87vIII tumors following intratumoral injections. (A) Axial T2*-w MR images of U87vIII tumor bearing mice on the day of and (B) 7 days after intratumoral injection of MPIO-labeled fNSCS (left) and hMSCs (right). (C) Corresponding CE-MR images, confirming the colocalization of MPIO-induced areas of hyposignal with the edges of the post-Gd enhancing tumors. The MPIO-labeled SCs/tumor cells injection site is shown as a filled circle; the dotted line shows the localization of the displayed imaging slices. MPIO-labeled SCs localized at the edges of the tumor (black arrows) and inside the tumor masses (white arrows).

