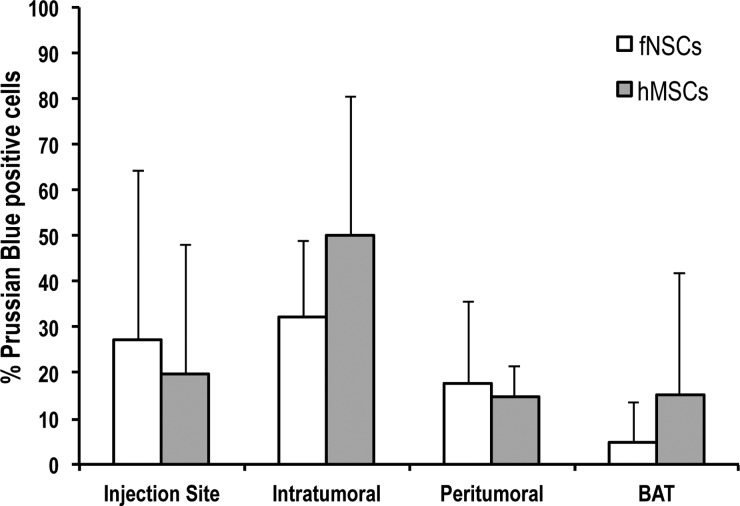
Fig. 8.
Analysis of the spatial distribution of MPIO-labeled SCs post-intratumoral injection in U87vIII tumors. The histogram presents the number of PB-positive cells in each of the 4 brain regions (injection site, intratumoral, peritumoral, and brain tissue adjacent to tumor [BAT]). No statistically significant differences in the number of PB cells could be found between the 2 SC types (P = .7, n = 3 per group).

