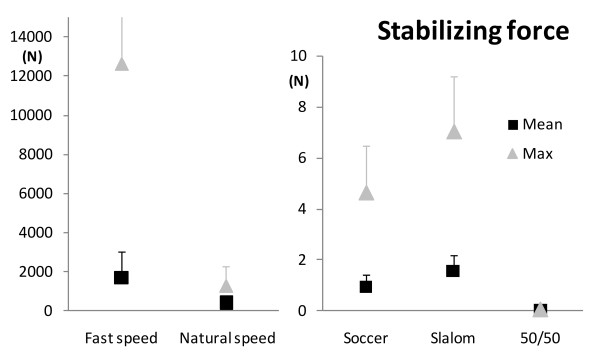
Figure 3.
Mean (black squares) and maximum (grey triangles) stabilizing force values for the group, for the five tasks. Higher stabilizing force represents lower dynamic stability. Error bars represent one standard deviation (SD) of the value. The maximum of the vertical axes was chosen to show most of the values despite large scale differences, without flattening the results with lower values. The standard deviation for the gait at fast speed is missing (SD = 17334.2 N).

