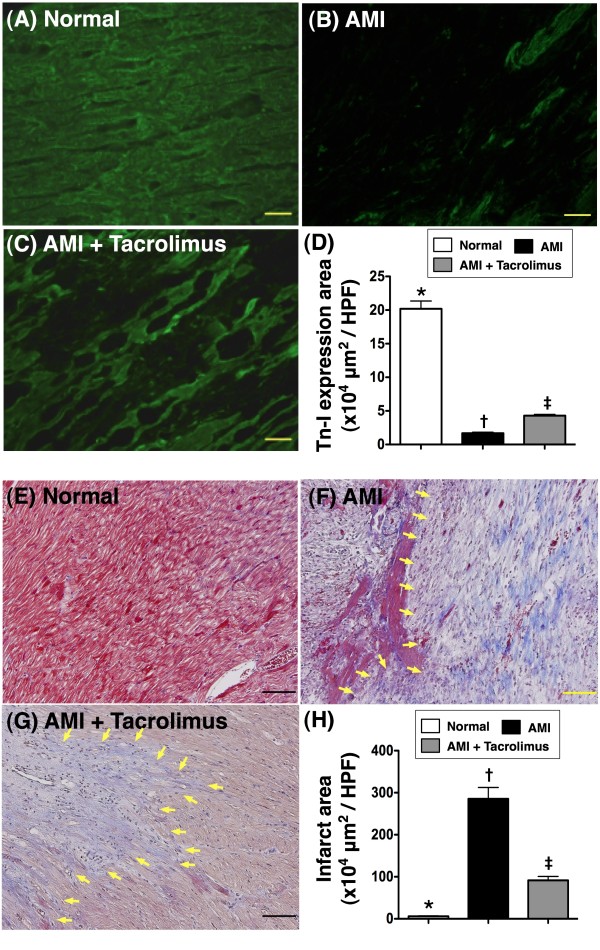
Figure 2.
Quantification of viable myocardium and fibrosis of myocardium in left ventricular infarct area. A to C) Showing immunofluorescence (400x) troponin-I positive staining of IA for detecting viable myocardium, demonstrating markedly decreased distribution of troponin-I positively stained myocardium in IA of AMI group than that in AMI + tacrolimus group on day 14 following AMI. D) * vs. other groups, p < 0.0001. (n = 6 for each group) E to G) The mean fibrotic area in IA was remarkably higher in AMI group than in AMI + tacrolimus group on Masson Trichrome staining (blue color in IA) (400x). This finding suggests that tacrolimus therapy effectively inhibited fibrosis in IA (yellow arrows) after AMI. H) * vs. other groups, p < 0.0001. All statistical analyses using one-way ANOVA, followed by Tukey’s multiple comparison procedure. Symbols (*, †, ‡) indicate significance (at 0.05 level) (n = 6 for each group). The Scale bars in right lower corner represent 20 μm. HPF, high-power field.

