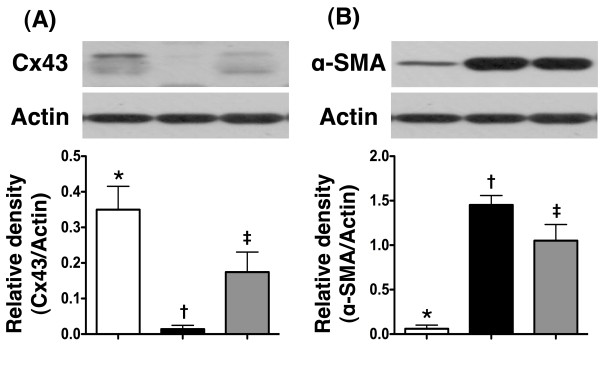
Figure 7.
Protein expressions of connexin43 and α-smooth muscle actin in infarcted area. A) Showing protein expression of connexin43 (Cx43) remarkably lower in AMI than in normal and AMI + tacrolimus, and significantly lower in AMI + tacrolimus than in normal (n = 6), * vs. other groups, p < 0.001. B) Demonstrating protein expression of α-smooth muscle actin (SMA) remarkably higher in AMI than in normal and AMI + tacrolimus, and markedly increased in AMI + tacrolimus than in normal, * vs. other groups, p < 0.0001. All statistical analyses using one-way ANOVA, followed by Tukey’s multiple comparison procedure. Symbols (*, †, ‡) indicate significance (at 0.05 level) (n = 6 for each group).

