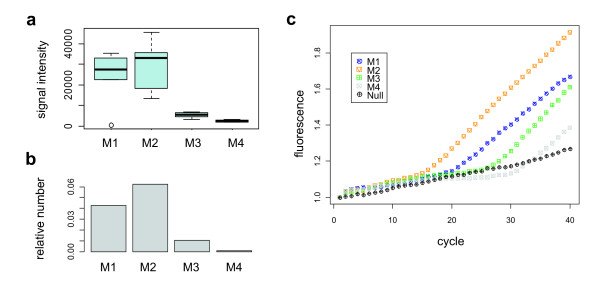
Figure 4.
Comparison of sequencing, microarray and qPCR. Performance of probe A123 on samples M1, M2, M3 and M4. (a) Relative abundance of sequencing reads corresponding to microarray probe A123 bacterial target groups, (b) microarray signal intensities and (c) TaqMan assay using the same probe sequence.

