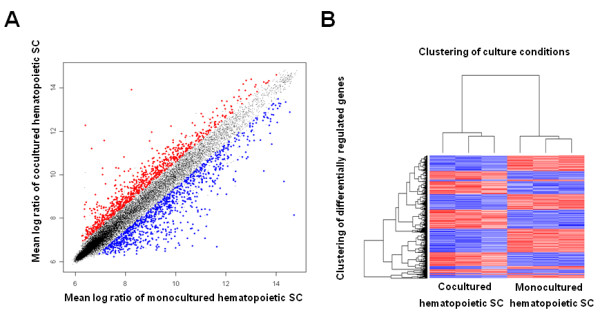
Figure 3.
displays the microarray analysis of cocultured hematopoietic SC. (a) Scatter plots showing the log ratios of the means of differentially regulated transcripts in cocultured hematopoietic SC plotted against monocultured hematopoietic SC. Red dots represent upregulation, blue dots downregulation. (b) Heat map displaying 3014 differentially regulated transcripts. Red colour represents upregulation, blue colour downregulation.

